Fig. 18.
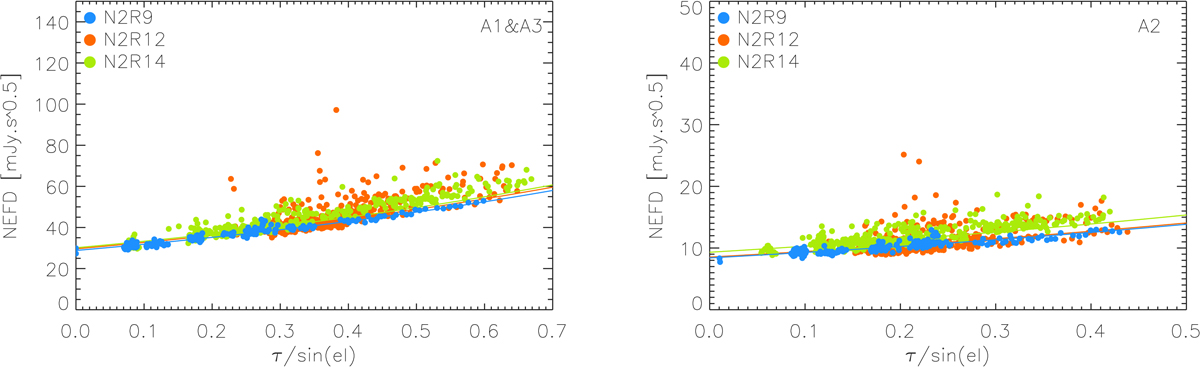
Comparison of NEFD estimates for three observation campaigns. The measured NEFD using the scatter method is plotted as a function of the line-of-sight atmospheric opacity (τνx) for the 1 mm (left) and 2 mm (right) channels. Data points are NEFD estimates in mJy s1/2 for N2R9 (blue), N2R12 (orange) and N2R14 (chartreuse). We also show the expected NEFD evolution with the line-of-sight atmospheric opacity in the plots as solid curves using the median zenith atmospheric opacity derived from all the scans acquired during a campaign.
Current usage metrics show cumulative count of Article Views (full-text article views including HTML views, PDF and ePub downloads, according to the available data) and Abstracts Views on Vision4Press platform.
Data correspond to usage on the plateform after 2015. The current usage metrics is available 48-96 hours after online publication and is updated daily on week days.
Initial download of the metrics may take a while.