Fig. 17.
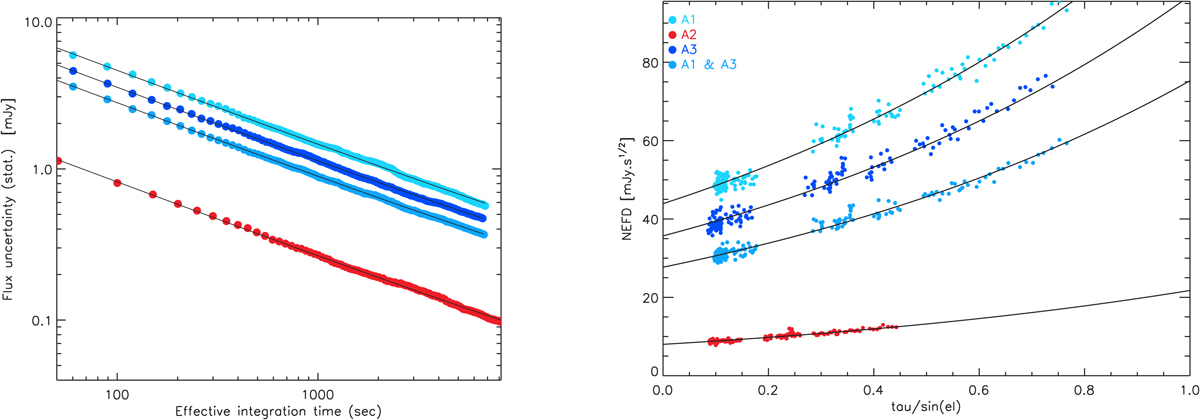
Comparison of NEFD estimates using two methods on observations of HLS J0918+5142. Left panel: evolution of the 1σ flux density uncertainties as a function of the effective integration time teff, as defined in Eq. (27), for A1 (cyan), A3 (dark blue), the combination of A1 and A3 (medium blue), and A2 (red). The solid black lines are the best-fit models using ![]() . Right panel: NEFD as a function of the measured line-of-sight atmospheric opacity using the same colour code as in the left panel. The solid black lines are the theoretical fits of NEFDτν, x = NEFD eτν x and give the NEFD when extrapolated to τν/sin(el) = 0.
. Right panel: NEFD as a function of the measured line-of-sight atmospheric opacity using the same colour code as in the left panel. The solid black lines are the theoretical fits of NEFDτν, x = NEFD eτν x and give the NEFD when extrapolated to τν/sin(el) = 0.
Current usage metrics show cumulative count of Article Views (full-text article views including HTML views, PDF and ePub downloads, according to the available data) and Abstracts Views on Vision4Press platform.
Data correspond to usage on the plateform after 2015. The current usage metrics is available 48-96 hours after online publication and is updated daily on week days.
Initial download of the metrics may take a while.