Fig. 16.
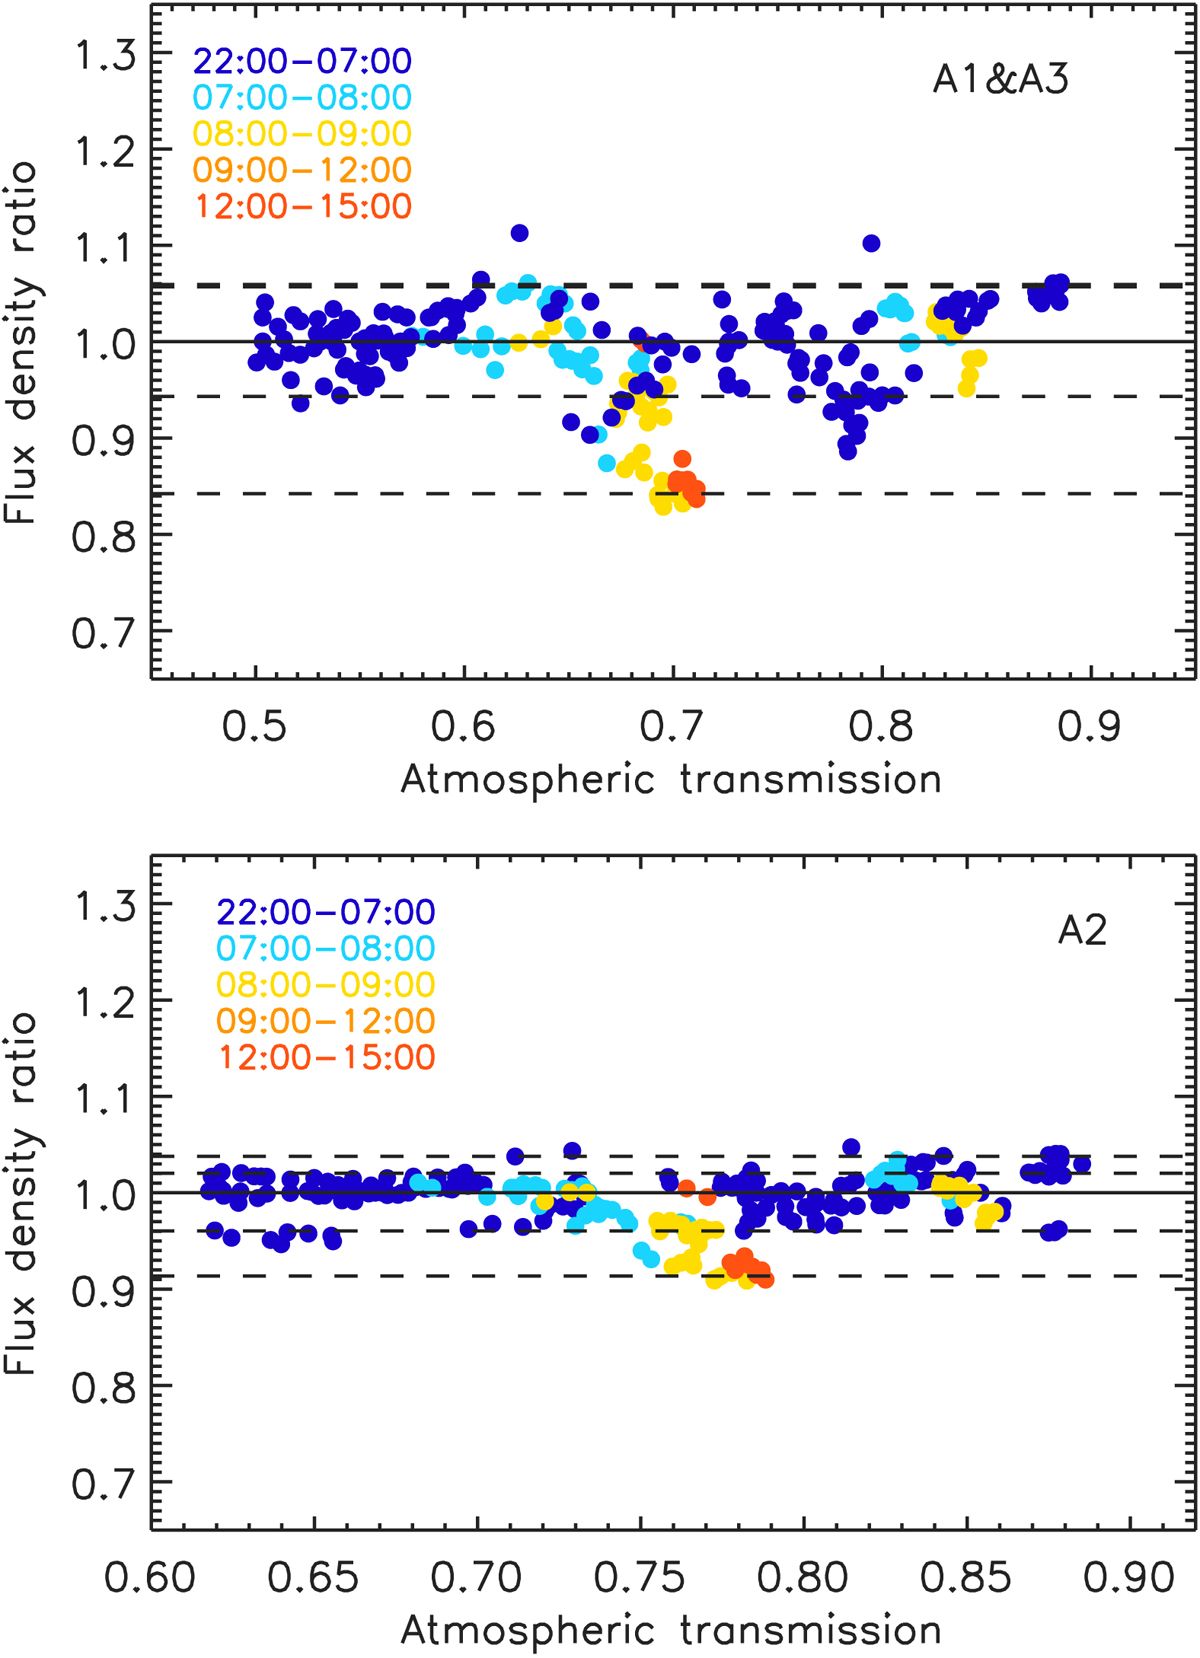
Baseline rms calibration uncertainties. The measured-to-median flux-density ratio of bright sources is plotted as a function of the atmospheric transmission, colour-coded according to the UT observation time of the scans for the combination of A1 and A3 (top panel) and for A2 (bottom panel). The inner dashed lines from either side of the unity-ratio line show the rms errors, which are less than 6% at 1 mm, and 3% at 2 mm, while the outer dashed lines show the 95% confidence level contours. The lowest flux-ratio data points correspond to some of the scans acquired during the daytime between 8:00 UT and 15:00 UT hours (yellow and red), while the scans acquired during the night between 22:00 UT and 7:00 UT yield data points (dark blue) well-distributed within the rms error with a few outliers.
Current usage metrics show cumulative count of Article Views (full-text article views including HTML views, PDF and ePub downloads, according to the available data) and Abstracts Views on Vision4Press platform.
Data correspond to usage on the plateform after 2015. The current usage metrics is available 48-96 hours after online publication and is updated daily on week days.
Initial download of the metrics may take a while.