Fig. 15.
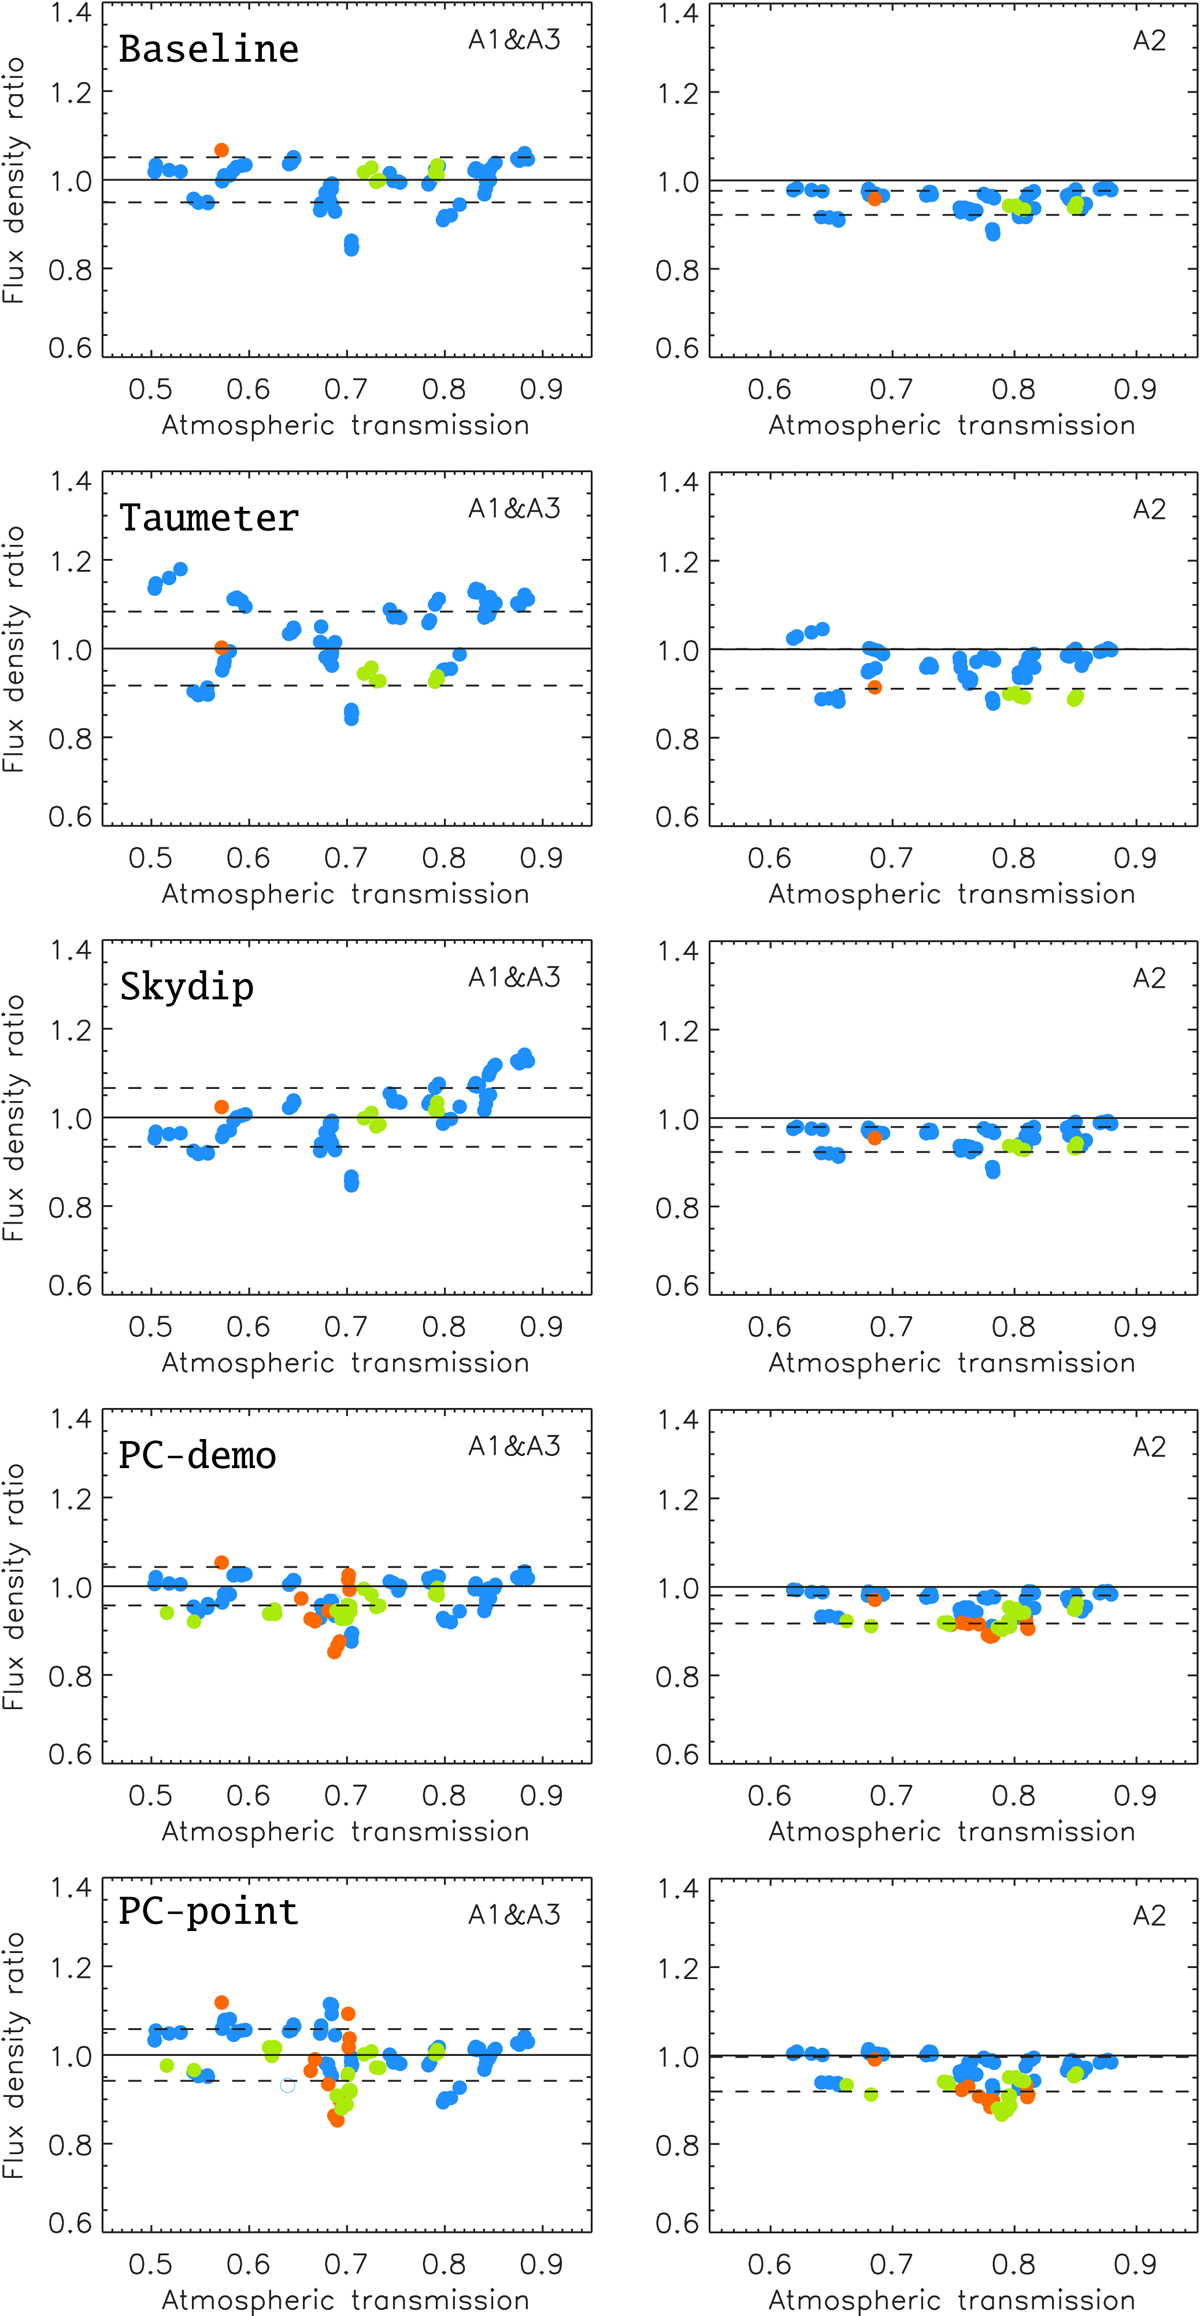
Comparison of calibration bias for five calibration methods using observations of MWC349. The measured-to-expected flux-density ratio is shown as a function of the atmospheric transmission for the Baseline method (first row), as well as for methods using the taumeter (second row) and skydip (third) opacity corrections, and for methods resorting to the PC-demo (fourth) and PC-point (fifth) photometric corrections. Dashed lines show the flux-density ratio rms errors.
Current usage metrics show cumulative count of Article Views (full-text article views including HTML views, PDF and ePub downloads, according to the available data) and Abstracts Views on Vision4Press platform.
Data correspond to usage on the plateform after 2015. The current usage metrics is available 48-96 hours after online publication and is updated daily on week days.
Initial download of the metrics may take a while.