Fig. 14.
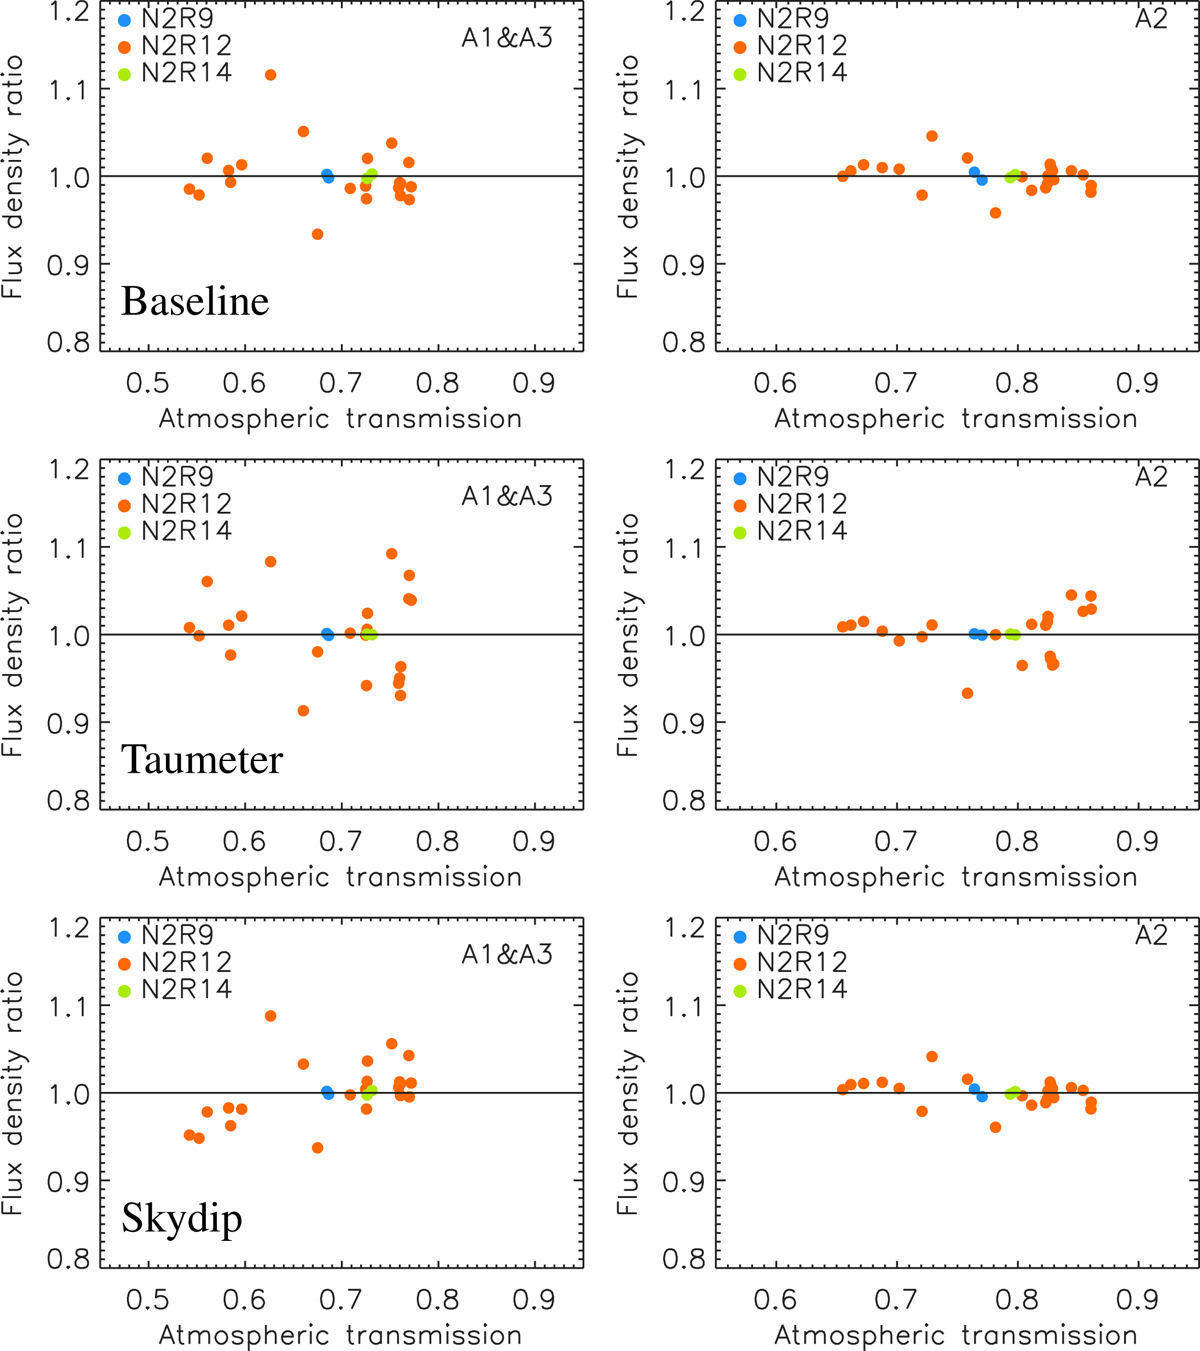
Uranus flux-density ratio vs atmospheric transmission shown for the 1 mm-array combination (left column) and for Array 2 (right column) after absolute calibration using (first row) the Baseline method, (second row) the “taumeter”-based and (third row) the “skydip”-based methods. These plots include all Uranus scans acquired during N2R9, N2R12, and N2R14 campaigns.
Current usage metrics show cumulative count of Article Views (full-text article views including HTML views, PDF and ePub downloads, according to the available data) and Abstracts Views on Vision4Press platform.
Data correspond to usage on the plateform after 2015. The current usage metrics is available 48-96 hours after online publication and is updated daily on week days.
Initial download of the metrics may take a while.