Fig. 13.
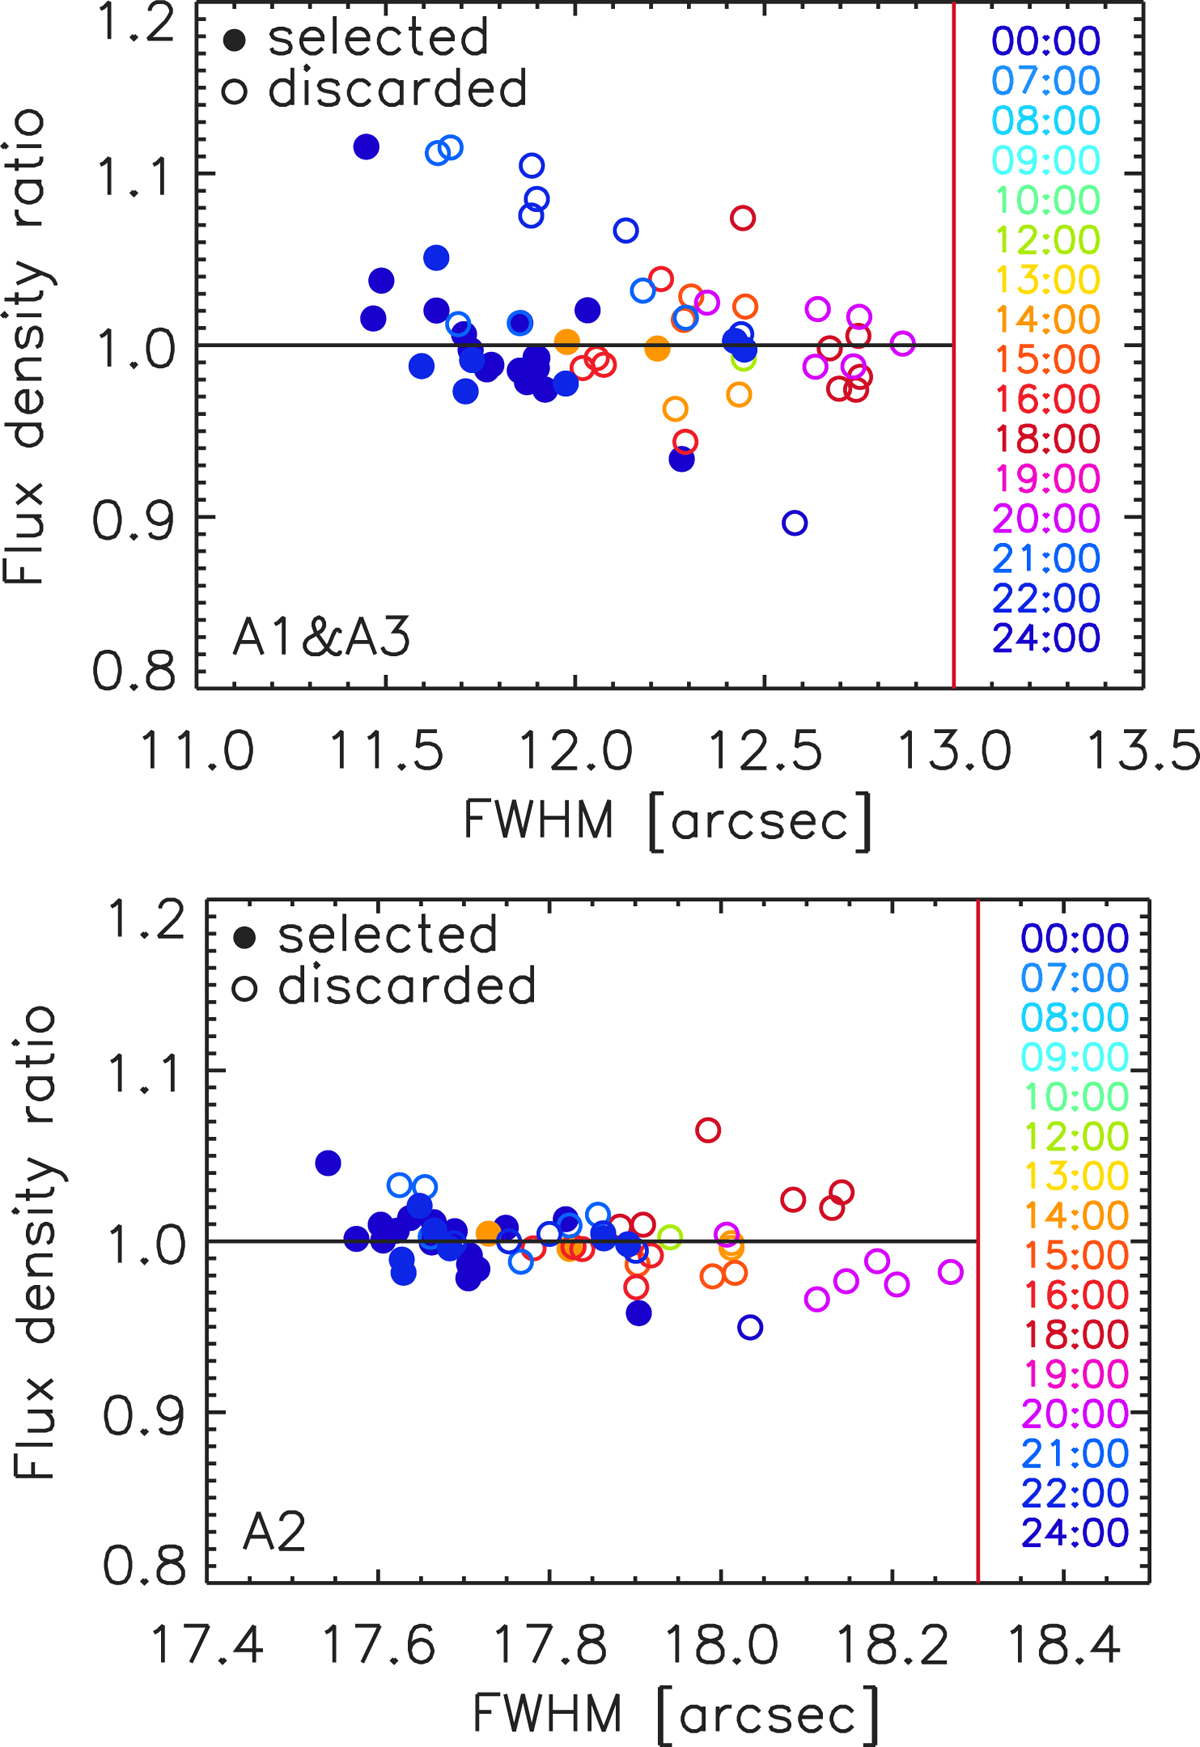
Uranus flux-density ratio vs beam size using the Baseline calibration. The ratio of Uranus measured-to-expected-flux densities as a function of the measured 2D Gaussian beam FWHM is shown for the 1 mm array combination (top panel) and for Array 2 (bottom panel) after absolute calibration using the Baseline method. These plots include all Uranus scans acquired during the N2R9, N2R12, and N2R14 campaigns and whose beam FWHMs are below the threshold indicated by the vertical red lines (open circles), as well as the scans that met the Baseline selection criteria (filled circles).
Current usage metrics show cumulative count of Article Views (full-text article views including HTML views, PDF and ePub downloads, according to the available data) and Abstracts Views on Vision4Press platform.
Data correspond to usage on the plateform after 2015. The current usage metrics is available 48-96 hours after online publication and is updated daily on week days.
Initial download of the metrics may take a while.