Fig. 11.
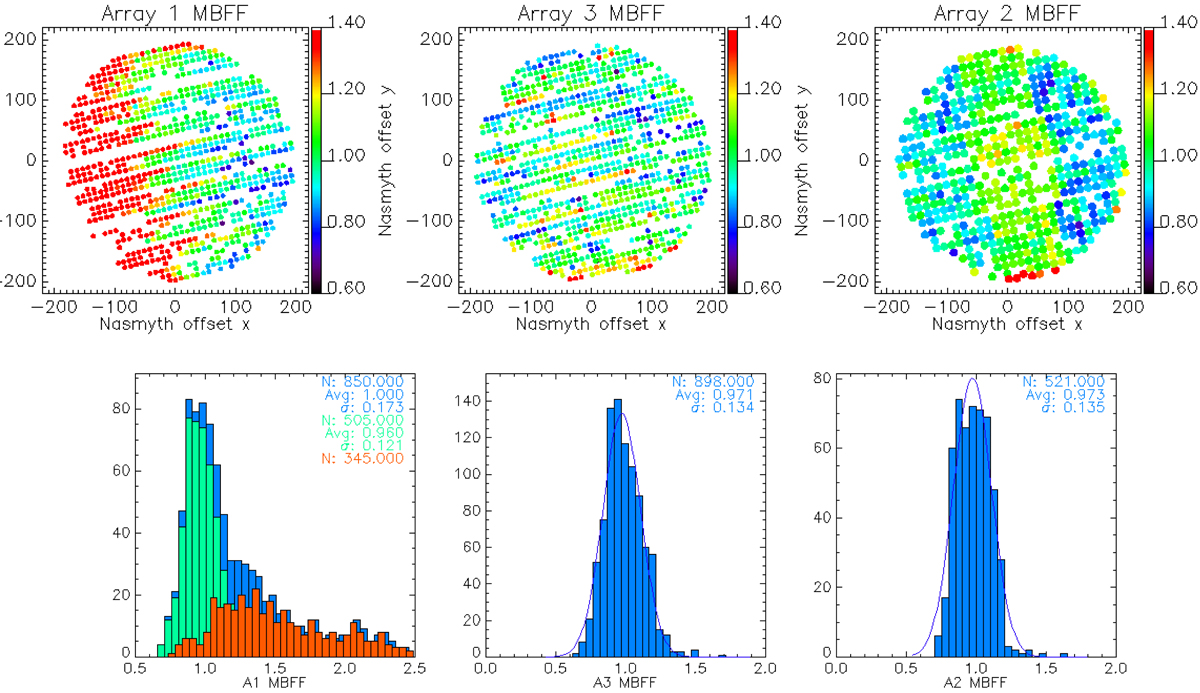
Average main-beam flat fields obtained by combining the flat fields of five beammap scans. Top row plots: normalised average flat fields of Arrays 1, 3, and 2, respectively. The offset positions with respect to the centre of the array are given in arcseconds in the Nasmyth coordinate system. The colour code gives the value of the KID calibration coefficients, as defined in Eq. (20), normalised by the average calibration coefficient over all the KIDs of the array. Bottom plots: average flat-field distributions using all KIDs (blue), using Array-1 KIDs that are positioned out of the shadow zone (green) and using Array-1 KIDs inside the shadow zone, which is defined in the text.
Current usage metrics show cumulative count of Article Views (full-text article views including HTML views, PDF and ePub downloads, according to the available data) and Abstracts Views on Vision4Press platform.
Data correspond to usage on the plateform after 2015. The current usage metrics is available 48-96 hours after online publication and is updated daily on week days.
Initial download of the metrics may take a while.