Fig. 8.
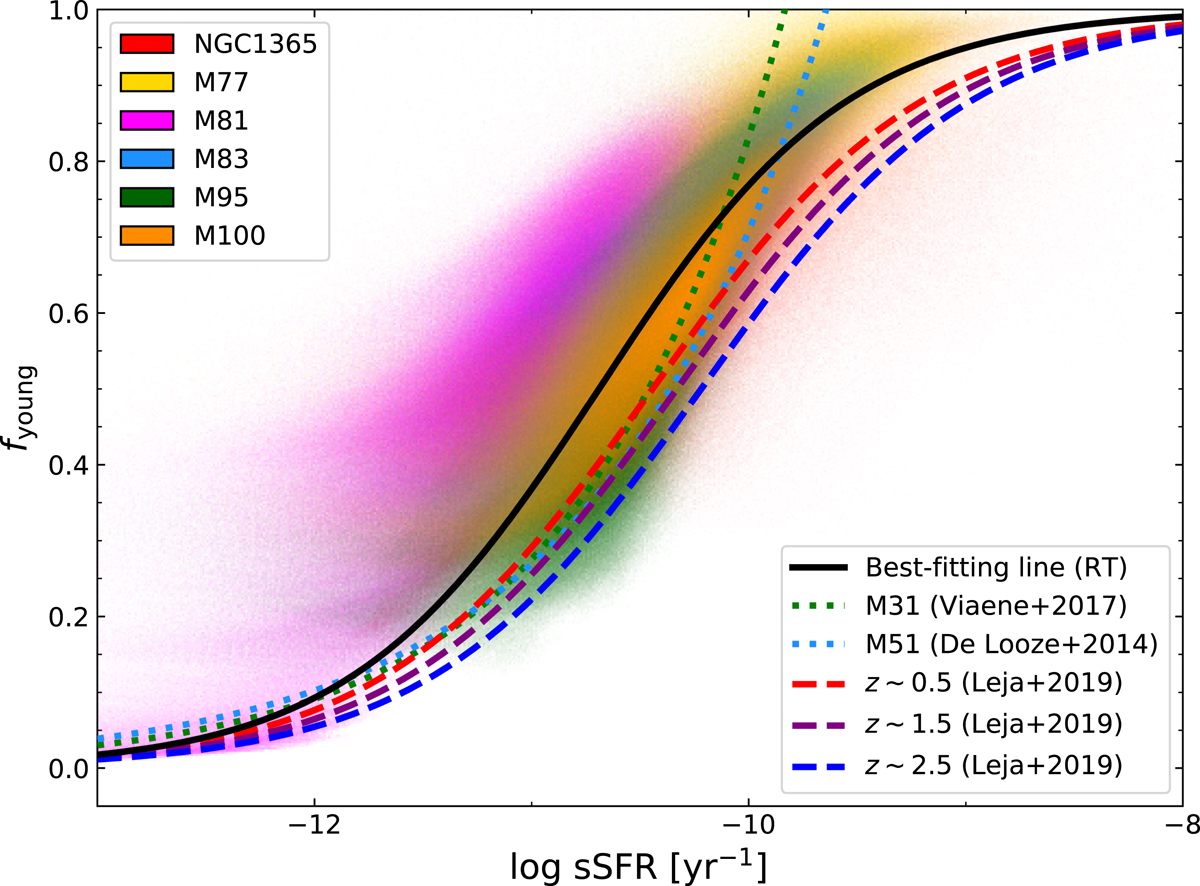
Relation between sSFR and fyoung, shown for the radiation transfer models of: NGC 1365, M 83, M 95, M 100 (this work); M 81 (Verstocken et al. 2020); and M 77 (Viaene et al. 2020). Each galaxy dataset is assigned with a different colour indicated in the upper left corner of the figure. The solid black line shows the fit from Eq. (4) through all data cells of every galaxy (RT). For comparison purposes we also provide the best-fitted power-laws of: M 31 (dotted green line, Viaene et al. 2017); M 51 (dotted cyan line, De Looze et al. 2014); and the relations derived by Leja et al. (2019) for a sample of galaxies from the 3D-HST catalogues at three redshift bins: z ∼ 0.5 (dashed red line), z ∼ 1.5 (dashed purple line), and z ∼ 2.5 (dashed blue line).
Current usage metrics show cumulative count of Article Views (full-text article views including HTML views, PDF and ePub downloads, according to the available data) and Abstracts Views on Vision4Press platform.
Data correspond to usage on the plateform after 2015. The current usage metrics is available 48-96 hours after online publication and is updated daily on week days.
Initial download of the metrics may take a while.