Fig. 7.
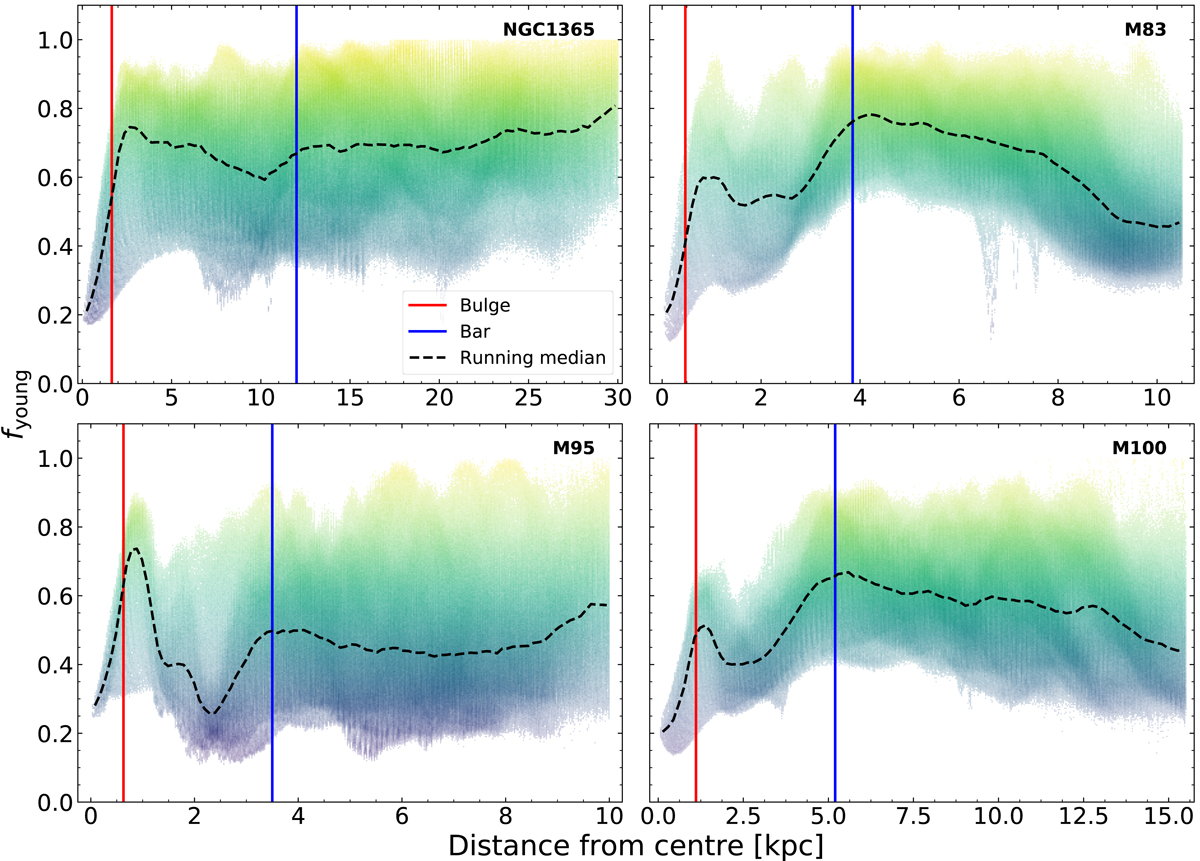
Distribution of fyoung calculated for every galaxy with galactocentric distance. Each point represents a dust cell and it is colour-coded according to fyoung. The level of transparency indicates the points density. The radius of the bulge is indicated with a vertical red line while the vertical blue line denotes the outer truncation radius of the Ferrers-bar. The dashed black line is the running median through the data points.
Current usage metrics show cumulative count of Article Views (full-text article views including HTML views, PDF and ePub downloads, according to the available data) and Abstracts Views on Vision4Press platform.
Data correspond to usage on the plateform after 2015. The current usage metrics is available 48-96 hours after online publication and is updated daily on week days.
Initial download of the metrics may take a while.