Fig. 6.
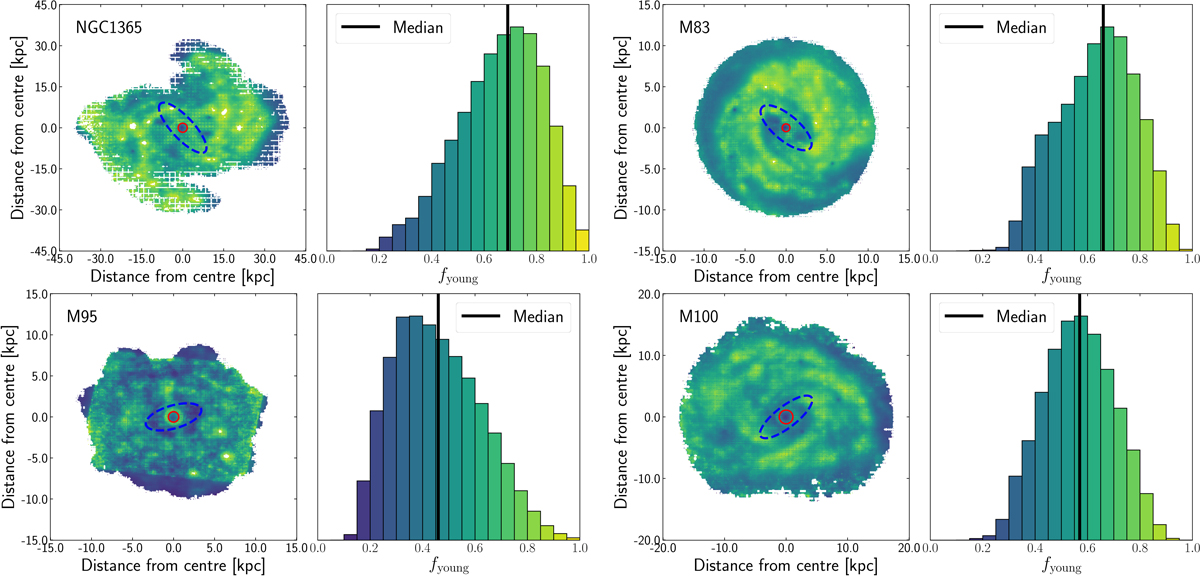
Left panel of each sub-figure: face-on view of the heating fraction by young non-ionising and young ionising stellar populations (Eq. (3)), as obtained from the 3D dust cell distribution, for each galaxy. The bulge region of every galaxy is indicated with a solid red circle and the bar region with a dashed blue ellipse (see text for more details). Right panel of each sub-figure: distribution of the dust cell heating fractions, weighted by dust mass. The histogram also denotes the colour coding of the map on the left. The solid black line shows the median value.
Current usage metrics show cumulative count of Article Views (full-text article views including HTML views, PDF and ePub downloads, according to the available data) and Abstracts Views on Vision4Press platform.
Data correspond to usage on the plateform after 2015. The current usage metrics is available 48-96 hours after online publication and is updated daily on week days.
Initial download of the metrics may take a while.