Fig. 4.
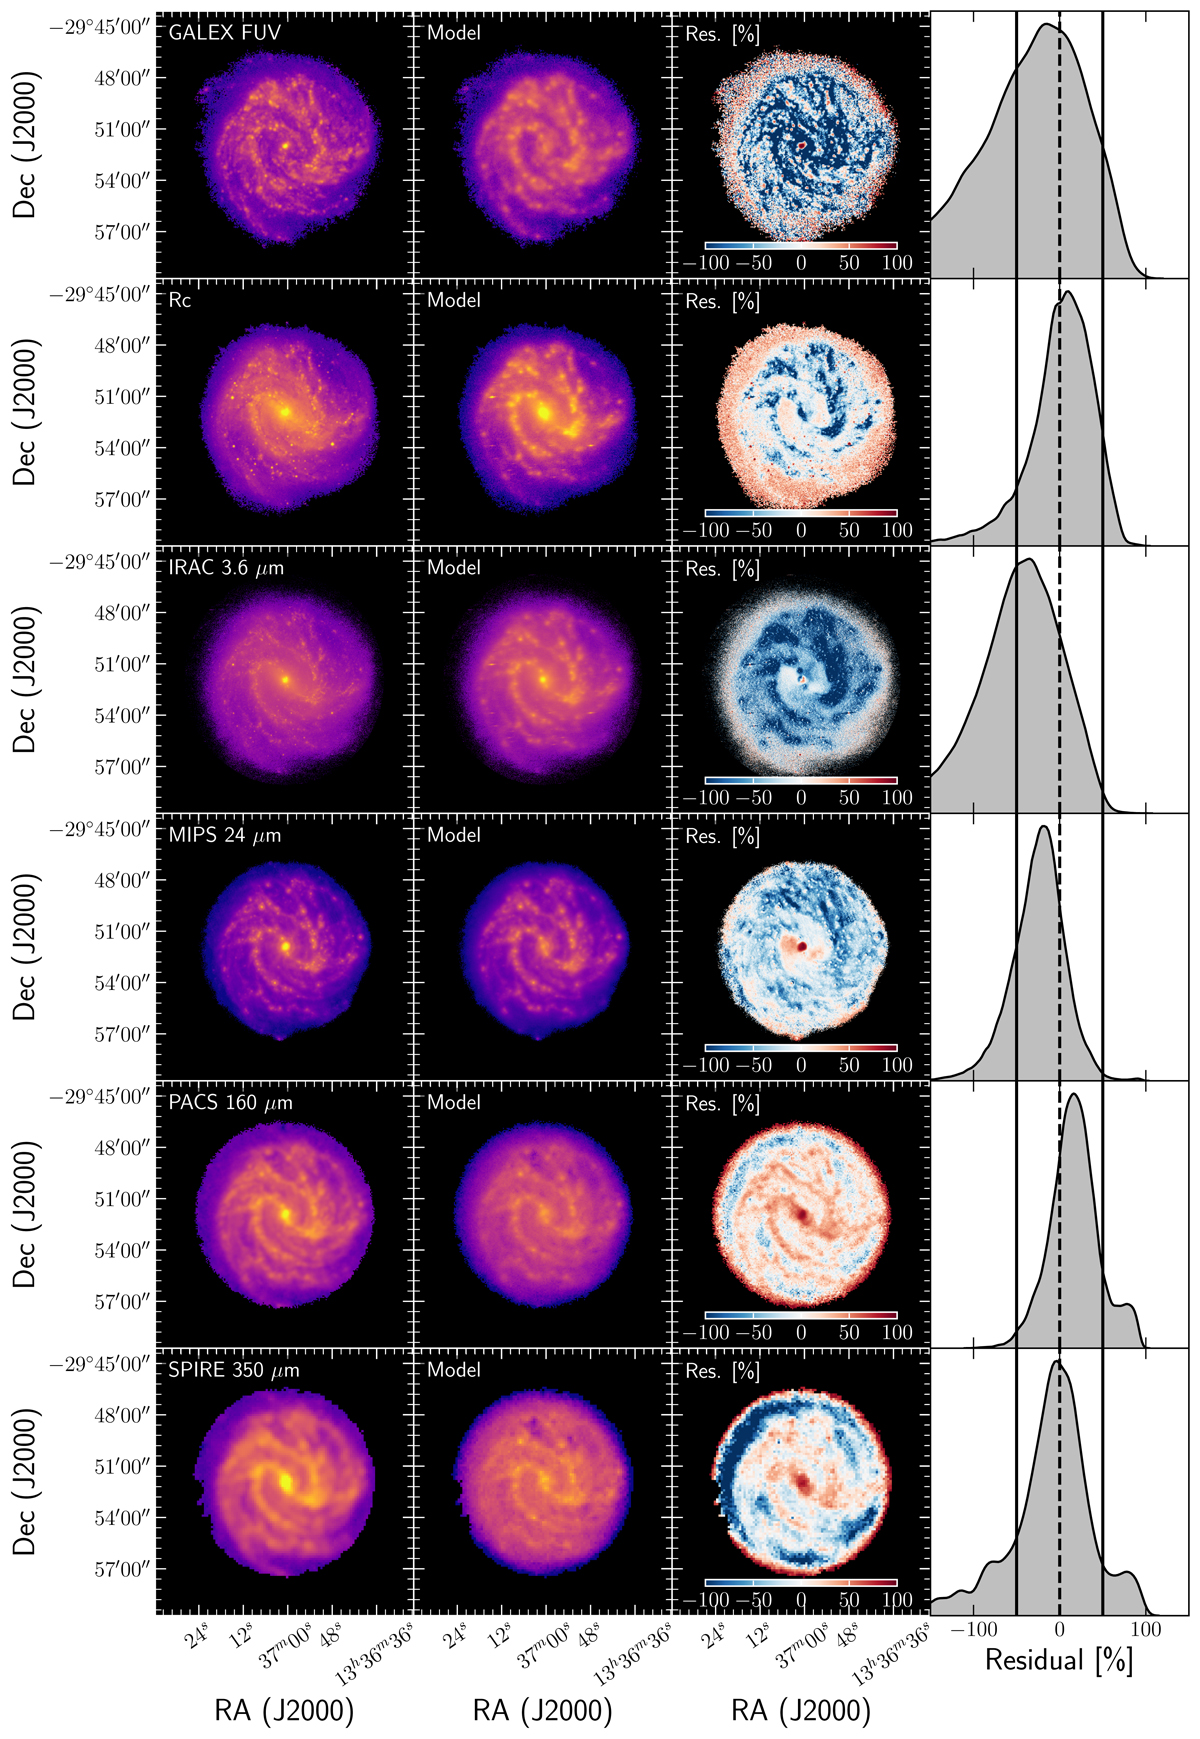
Comparison of the simulated images with observations in selected wavebands for M 83. First column: observed images, second column: simulated images, third column: maps of the relative residuals between observed and simulated images, and last column: KDE of the distributions of the residual pixel values. The simulated images have the same pixel mask as the observed images. The colour coding of the first two columns is in log scale and reflects a normalised flux density. The selected wavebands are: GALEX FUV, RC, IRAC 3.6 μm, MIPS 24 μm, PACS 160 μm, and SPIRE 350 μm.
Current usage metrics show cumulative count of Article Views (full-text article views including HTML views, PDF and ePub downloads, according to the available data) and Abstracts Views on Vision4Press platform.
Data correspond to usage on the plateform after 2015. The current usage metrics is available 48-96 hours after online publication and is updated daily on week days.
Initial download of the metrics may take a while.