Fig. C.1.
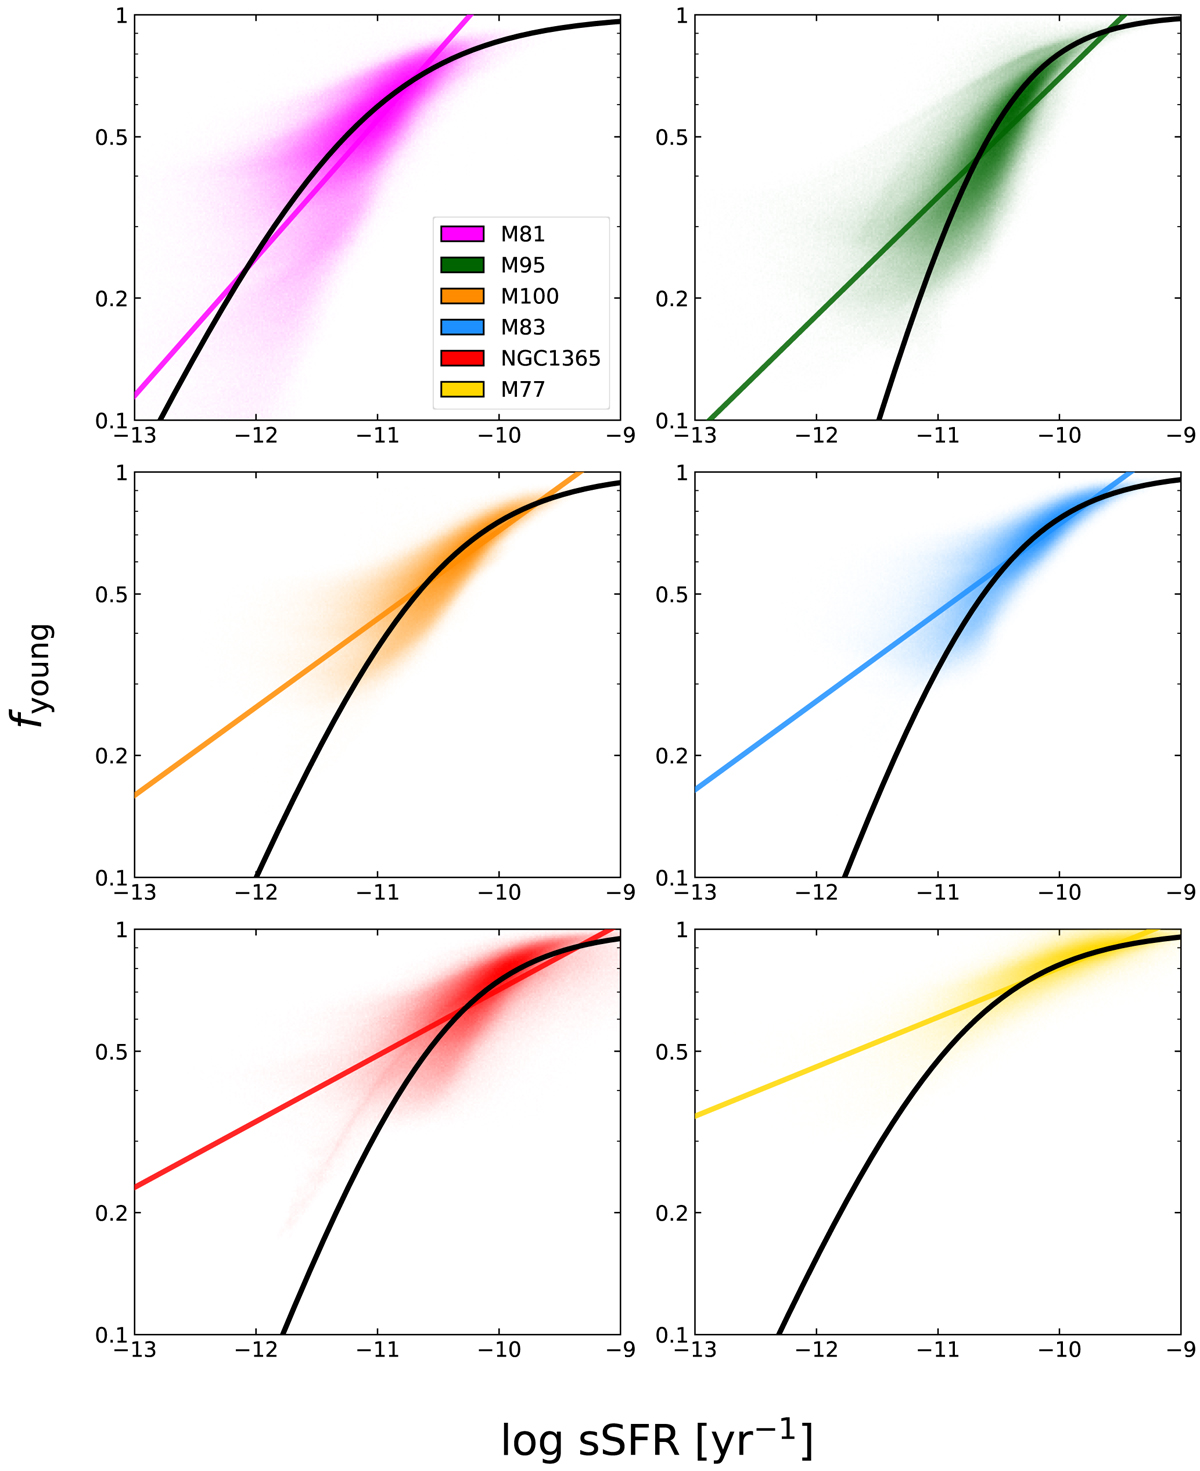
Relation between sSFR and fyoung, shown for the radiation transfer models of: NGC 1365, M 83, M 95, M 100 (this work); M 81 (Verstocken et al. 2020); and M 77 (Viaene et al. 2020). Each galaxy dataset is assigned with a different colour indicated in the lower right corner of the first panel. The solid black line shows the fit from Eq. (4) through the bulk of data cells of every galaxy. Each coloured line shows the best-fitting power-law through the bulk of data cells of every galaxy.
Current usage metrics show cumulative count of Article Views (full-text article views including HTML views, PDF and ePub downloads, according to the available data) and Abstracts Views on Vision4Press platform.
Data correspond to usage on the plateform after 2015. The current usage metrics is available 48-96 hours after online publication and is updated daily on week days.
Initial download of the metrics may take a while.