Fig. 7.
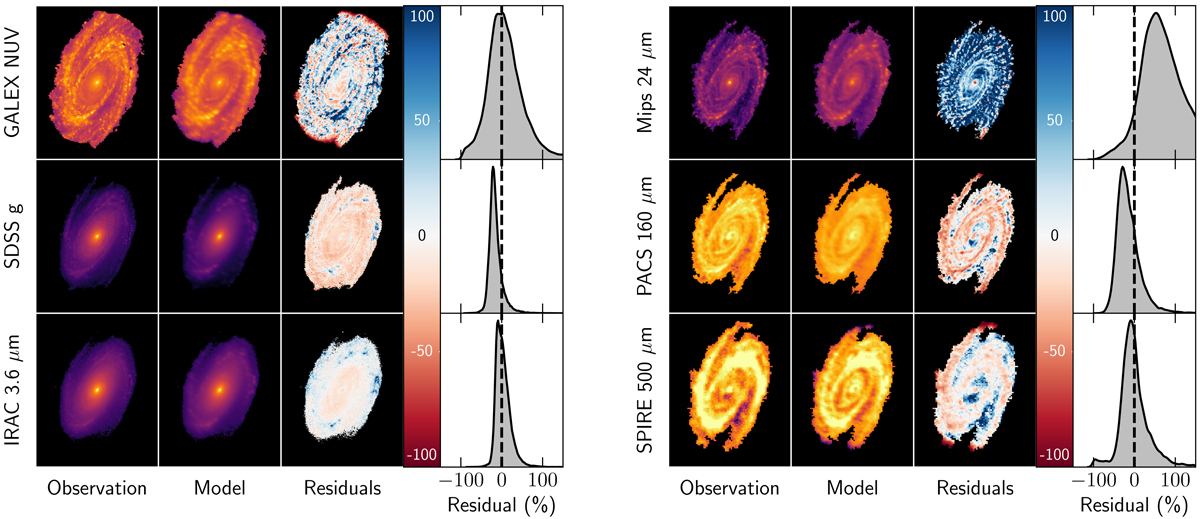
Comparison between observed and simulated images in 6 different wavebands. First column: observed images. Second column: mock images, created by spectrally convolving the simulated data cube. Third column: maps of the relative residuals between observed and mock images. Last column: distributions of the residual pixel values. The mock images are clipped to the same pixel mask as the observed images. The probability density functions of the residuals are calculated with a kernel density estimation (KDE).
Current usage metrics show cumulative count of Article Views (full-text article views including HTML views, PDF and ePub downloads, according to the available data) and Abstracts Views on Vision4Press platform.
Data correspond to usage on the plateform after 2015. The current usage metrics is available 48-96 hours after online publication and is updated daily on week days.
Initial download of the metrics may take a while.