Fig. 6.
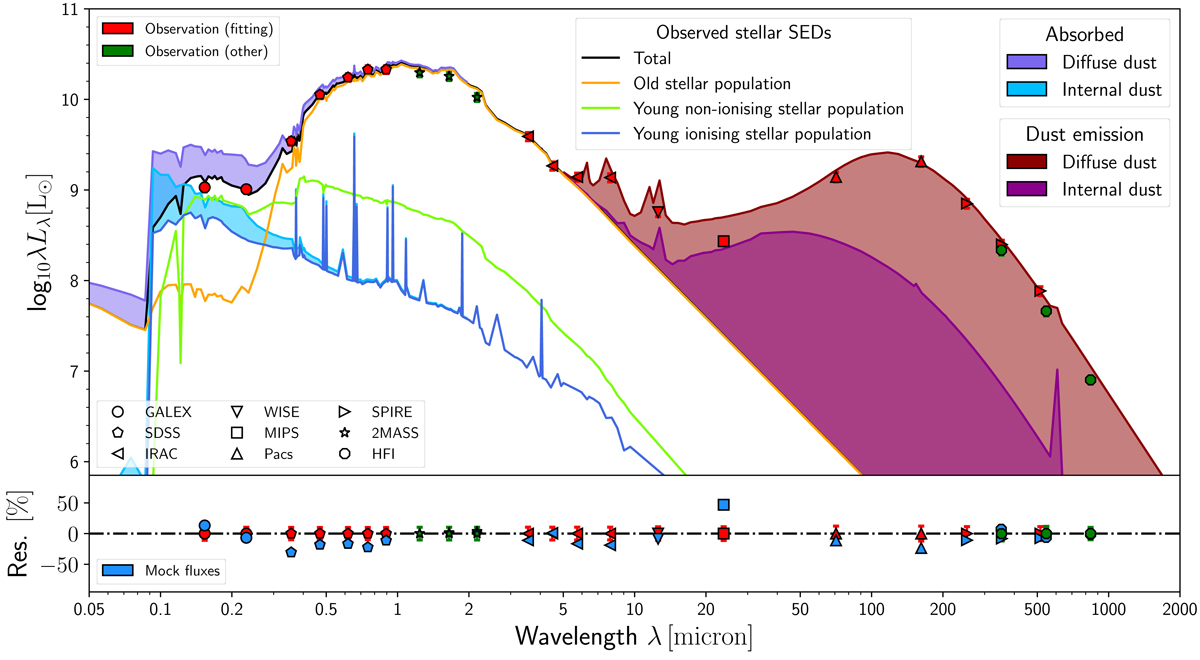
Top panel: panchromatic SED corresponding to the SKIRT radiative transfer model for M 81. The total observed stellar energy output is indicated with a black line and the total dust emission, when added to the stellar spectrum, follows the red line. The area shaded in purple above the observed stellar spectrum represents the radiation that is absorbed by the diffuse dust, thus the purple line represents the intrinsic stellar spectrum. Yellow, green, and dark blue lines represent the contribution of the old, the young non-ionising, and the young ionising stellar populations to the observed stellar spectrum, respectively. The area shaded in light blue above the young ionising population curve indicates the absorbed energy by internal (subgrid) dust. The area shaded in magenta between 20 and 500 μm indicates the energy distribution emitted by this internal dust. Bottom panel: comparison between the observed fluxes and the simulated SED, as relative residuals with the observations as reference. Observed fluxes are shown as red and green points, depending whether or not they were used in the fitting procedure. The blue points show the mock fluxes derived from the simulated SED.
Current usage metrics show cumulative count of Article Views (full-text article views including HTML views, PDF and ePub downloads, according to the available data) and Abstracts Views on Vision4Press platform.
Data correspond to usage on the plateform after 2015. The current usage metrics is available 48-96 hours after online publication and is updated daily on week days.
Initial download of the metrics may take a while.