Fig. 5.
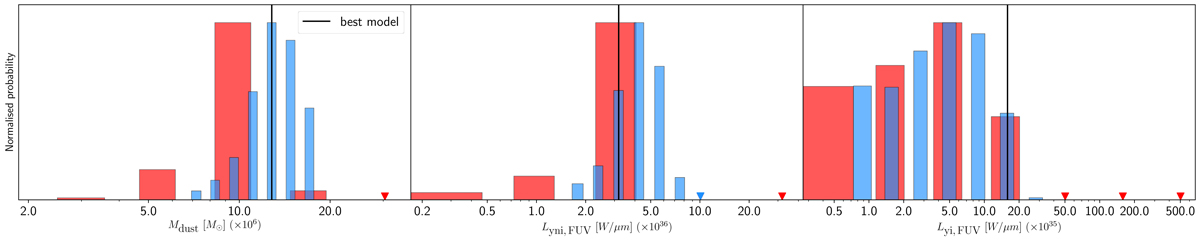
Probability distributions of the RT models for the first batch (red) and the second batch of simulations (blue). From left to right: diffuse dust mass, the FUV luminosity of the young non-ionising disc, and the FUV luminosity of the young ionising stellar disc. For the second run, the values of the overall best-fitting simulation are indicated by the vertical lines.
Current usage metrics show cumulative count of Article Views (full-text article views including HTML views, PDF and ePub downloads, according to the available data) and Abstracts Views on Vision4Press platform.
Data correspond to usage on the plateform after 2015. The current usage metrics is available 48-96 hours after online publication and is updated daily on week days.
Initial download of the metrics may take a while.