Fig. 3.
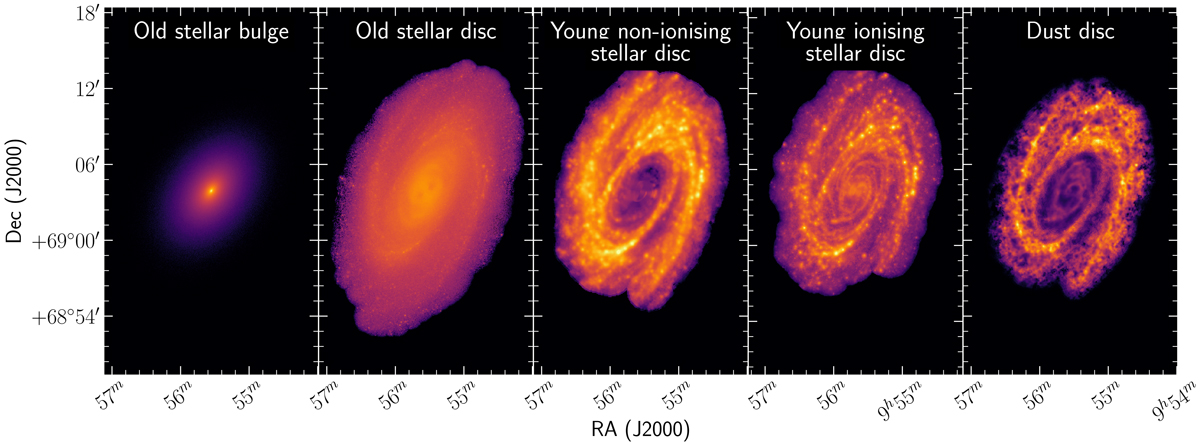
2D view of the different model components, including a bulge and disc component for the old stellar population, discs of young non-ionising and ionising stellar populations, and the disc of the dust distribution. The bulge image has been rendered with SKIRT by using the 3D bulge description and the appropriate instrument setup. The disc component maps have been produced with recipes directly using the observed multi-wavelength images, as detailed in the text. The different maps have different native resolutions based on the respective observations that were used to create these maps. These resolutions are ![]() for the old stellar bulge and disc,
for the old stellar bulge and disc, ![]() for the young non-ionising stellar disc,
for the young non-ionising stellar disc, ![]() for the young ionising stellar disc, and
for the young ionising stellar disc, and ![]() for the dust disc (see Table 1). The removal of unphysical pixels due to different signal-to-noise in each of the bands leads to a varying contour for the different components.
for the dust disc (see Table 1). The removal of unphysical pixels due to different signal-to-noise in each of the bands leads to a varying contour for the different components.
Current usage metrics show cumulative count of Article Views (full-text article views including HTML views, PDF and ePub downloads, according to the available data) and Abstracts Views on Vision4Press platform.
Data correspond to usage on the plateform after 2015. The current usage metrics is available 48-96 hours after online publication and is updated daily on week days.
Initial download of the metrics may take a while.