Fig. B.1.
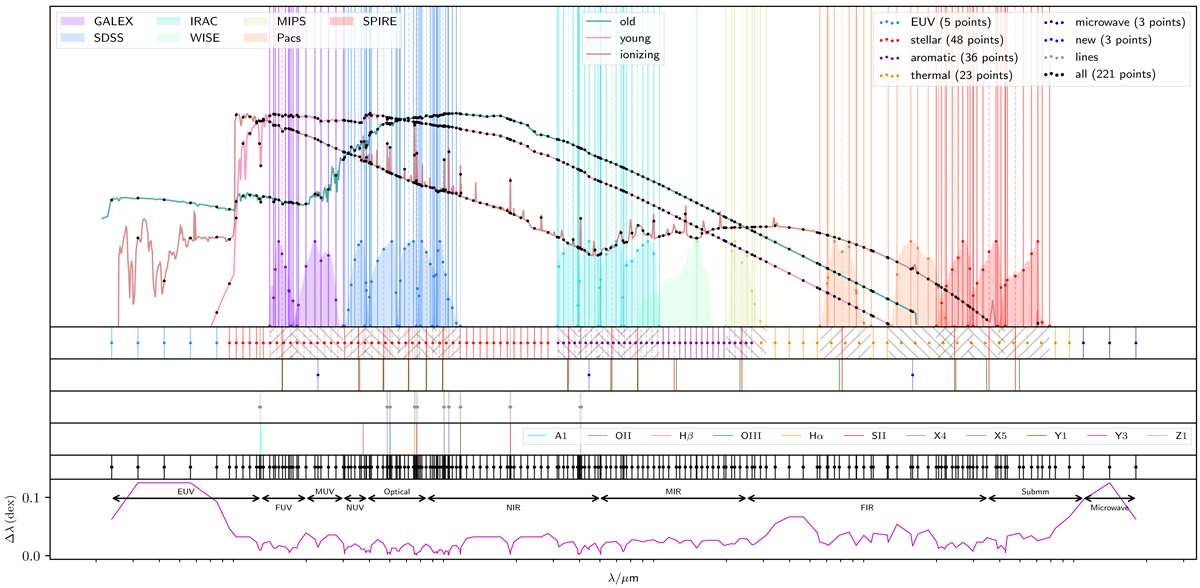
Wavelength grid used for the RT simulations. Top panel: 3 different stellar template spectra used for the models, on an arbitrary scale and normalised independently to match the frame. Rendered on top of these curves are black dots that show the points of the wavelength grid, to illustrate how they sample the intrinsic spectra of our model components. Also shown are the transmission curves of the filters for which we have observed data and for which we create mock observations. The coloured vertical lines plotted on top of these response curves show the additional sampling that is performed for each band, also shown as dots. Second panel: sampling of the different regimes with different densities, in a different colour per regime. The grid points with dashed vertical lines, and crossed out with the diagonal pattern, are removed and replaced by the wavelengths added for the sampling of the above filter response curve, because the number of points within the filter range was not sufficient. Third panel: wavelength grid points that have been placed at the effective wavelengths of the different bands. When this wavelength is close to an existing wavelength point, it replaces the original one (red and green lines), otherwise it is added as an additional wavelength (blue line and dot). Fourth panel: extra sampling that has been performed for prominent absorption and emission line features in the stellar spectra, adding a grid point at the peak (or valley) of the feature and at its edges. The position and origin of the corresponding line features are indicated in the fifth panel. The resulting wavelength grid is shown in the sixth panel. The density of the total grid in logarithmic space is plotted in the bottom panel, showing that the distance between any subsequent wavelengths in the grid is well below 0.05 dex, except in the EUV where the stellar emission is insignificant.
Current usage metrics show cumulative count of Article Views (full-text article views including HTML views, PDF and ePub downloads, according to the available data) and Abstracts Views on Vision4Press platform.
Data correspond to usage on the plateform after 2015. The current usage metrics is available 48-96 hours after online publication and is updated daily on week days.
Initial download of the metrics may take a while.