Fig. 14.
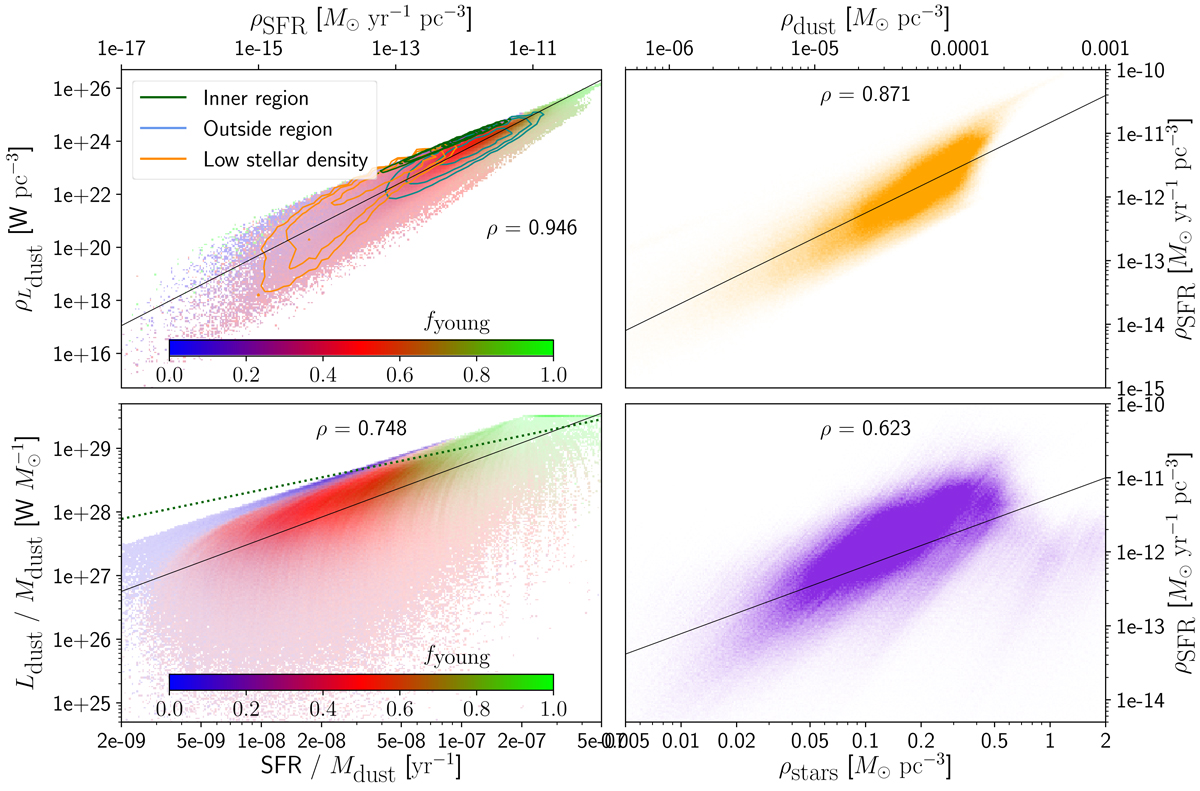
Scatter density plots between different stellar and dust quantities from the M 81 dust cell data. Spearman rank correlation coefficients are shown at the top of each panel, and power-law fits through the data are shown as black lines. Top left panel: dust luminosity density as a function of star-formation rate density, with fyoung on the auxiliary axis. Top right panel: correlation between dust mass density and star-formation rate density. Bottom left panel: both the star-formation rate and the dust luminosity plotted per unit of dust mass, with the heating fraction on the auxiliary axis. The dotted green line is the power-law fit through the points with fyoung > 0.8. Bottom right panel: correlation between the diffuse stellar mass density and the density of star-formation rate (ρSFR).
Current usage metrics show cumulative count of Article Views (full-text article views including HTML views, PDF and ePub downloads, according to the available data) and Abstracts Views on Vision4Press platform.
Data correspond to usage on the plateform after 2015. The current usage metrics is available 48-96 hours after online publication and is updated daily on week days.
Initial download of the metrics may take a while.