Fig. 11.
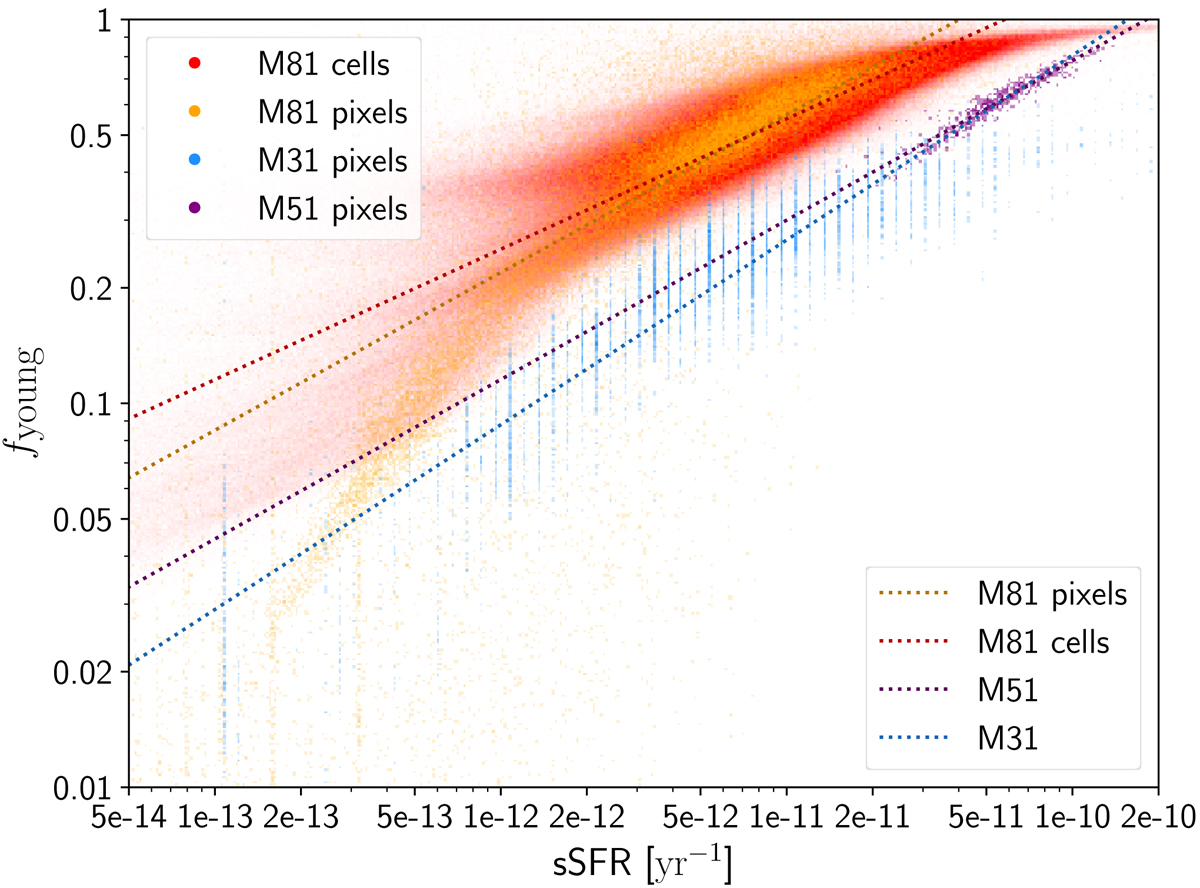
Correlation between sSFR and fyoung, shown as orange data points for the pixels and in red for the dust cells of the M 81 RT model. Blue and purple points are the values for the pixels of the M 31 (Viaene et al. 2017) and M 51 model (De Looze et al. 2014), respectively. Also shown are power-law fits to the data points in corresponding colours.
Current usage metrics show cumulative count of Article Views (full-text article views including HTML views, PDF and ePub downloads, according to the available data) and Abstracts Views on Vision4Press platform.
Data correspond to usage on the plateform after 2015. The current usage metrics is available 48-96 hours after online publication and is updated daily on week days.
Initial download of the metrics may take a while.