Free Access
Fig. 10.
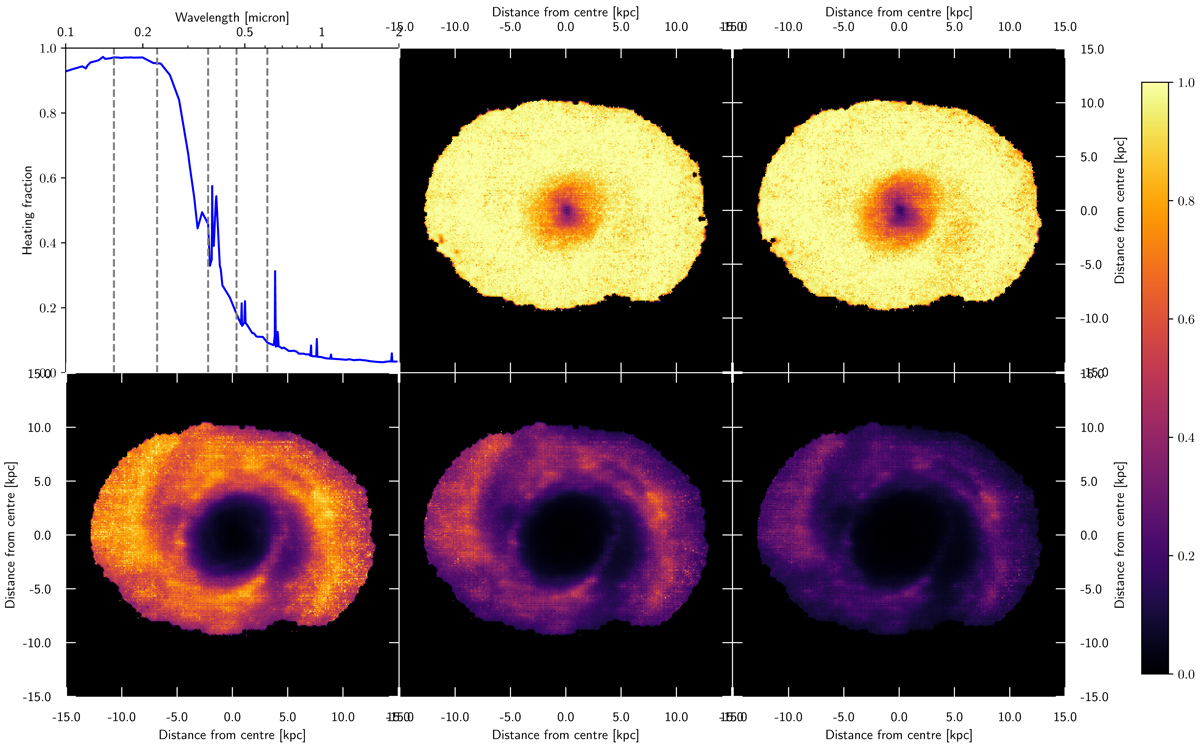
Top-left panel: curve of fyoung with respect to the wavelength at which the energy is absorbed. Five wavelengths have been indicated, corresponding to the GALEX FUV, GALEX NUV, SDSS u, SDSS g, and SDSS r effective wavelengths. For these filters, a projected map of fyoung in the dust cells is shown in the subsequent panels.
Current usage metrics show cumulative count of Article Views (full-text article views including HTML views, PDF and ePub downloads, according to the available data) and Abstracts Views on Vision4Press platform.
Data correspond to usage on the plateform after 2015. The current usage metrics is available 48-96 hours after online publication and is updated daily on week days.
Initial download of the metrics may take a while.