Fig. 4.
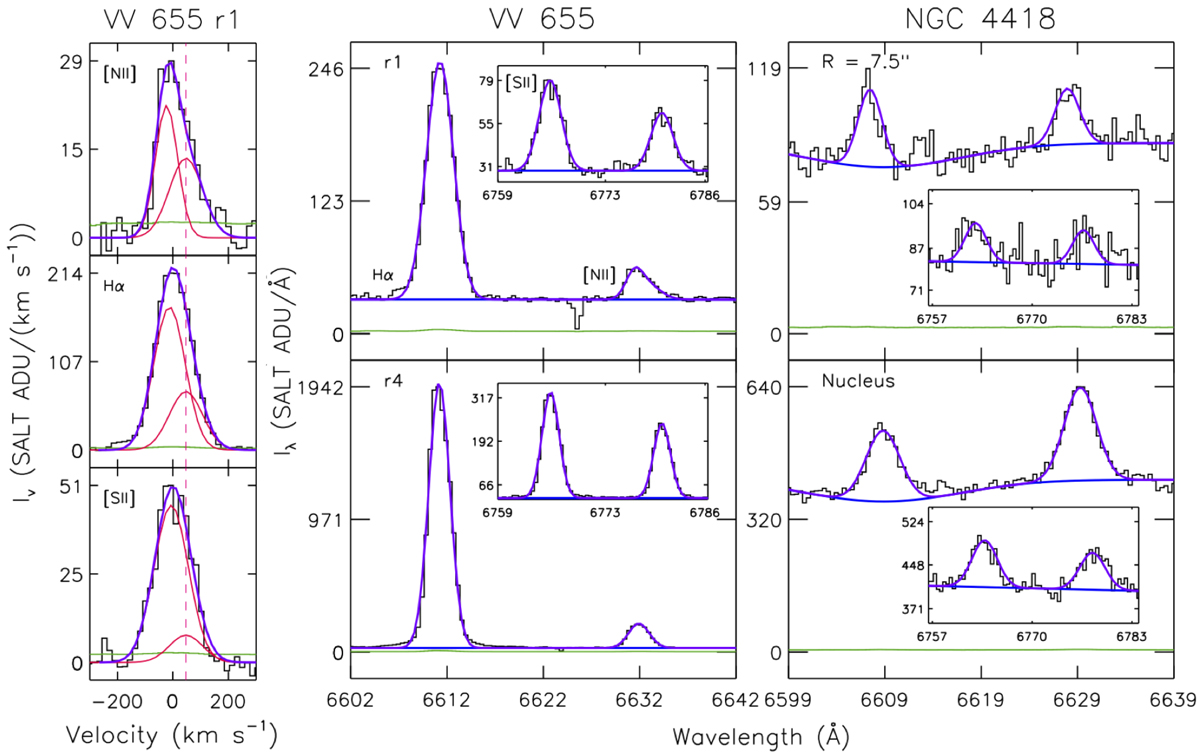
SALT-RSS spectra of emission lines in the Hα region from VV 655 (left) and NGC 4418 (right). The blue and purple lines indicate fits to the continuum and the single- and multi-component Gaussian emission-line profiles, respectively. The green curves indicate the error spectra. Spectra are shown for a diffuse (r1) and a star-forming region (r4) in VV 655 and near the nucleus and at an offset of R = 7.5″ (1.2 kpc) to the northwest in NGC 4418. The difference in the N2 value of approximately an order of magnitude between the galaxies suggests that the metallicity of the outflowing, ionized gas in NGC 4418 exceeds that of the HII regions in VV 655. As shown at left, in the diffuse regions of VV 655, a redshifted [NII]λ6583 wing extends beyond the velocity range where there are currently HI detections (Varenius et al. 2017). We indicate upper limits on the corresponding kinematic components in the Hα and [SII]λ6716 emission lines, which suggest that the redshifted component arises from gas with an N2 intensity ratio that exceeds the characteristic value for VV 655 by at least a factor of two. Thus, this feature likely indicates the presence of a shocked, ionized gas outflow. The wavelengths shown are the observed wavelengths. The feature near λ = 6624 Å is an instrumental artifact.
Current usage metrics show cumulative count of Article Views (full-text article views including HTML views, PDF and ePub downloads, according to the available data) and Abstracts Views on Vision4Press platform.
Data correspond to usage on the plateform after 2015. The current usage metrics is available 48-96 hours after online publication and is updated daily on week days.
Initial download of the metrics may take a while.