Fig. 7.
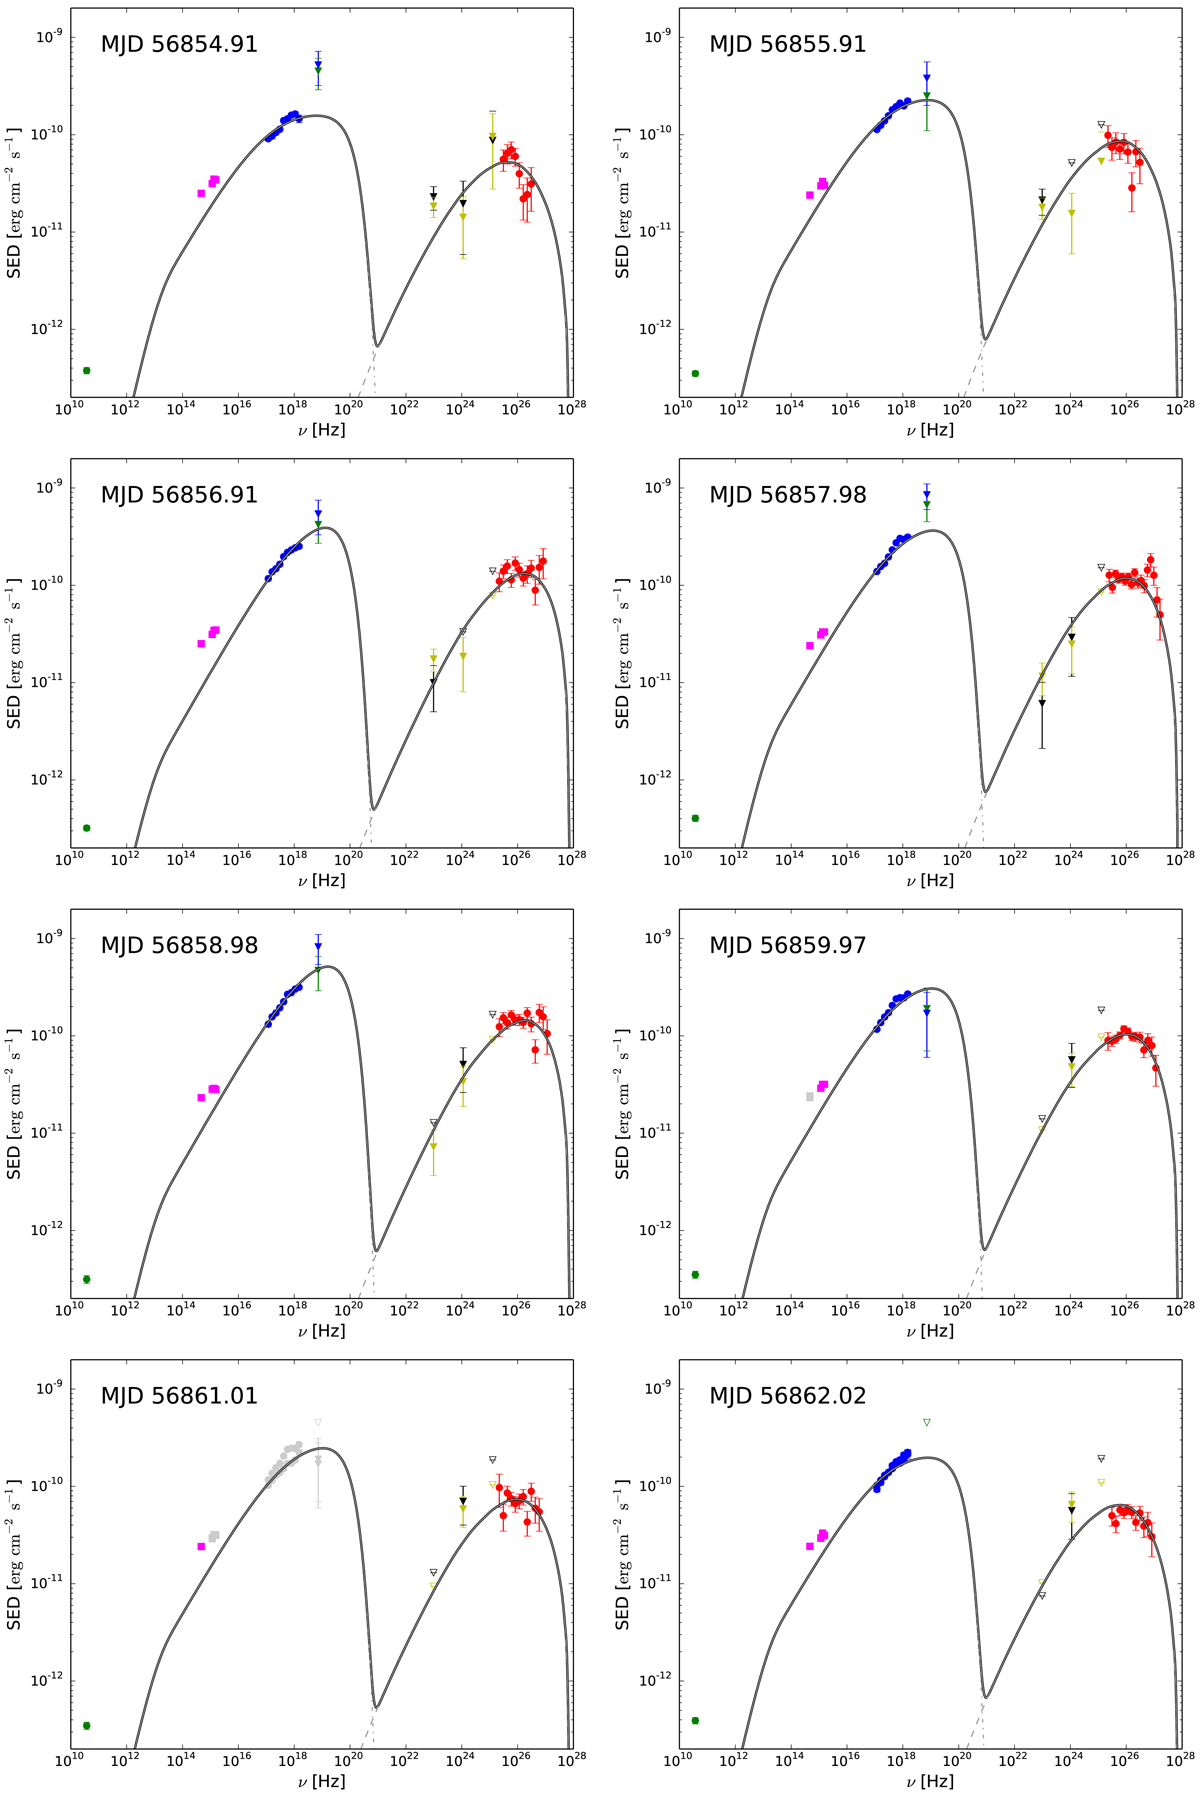
Single-night broadband SEDs described with a one-zone SSC model. The VHE gamma-ray spectra from MAGIC are represented by the red dots, the Fermi-LAT spectra by the black (4 days) and yellow (10 days) triangles, the BAT emission by the blue triangles (using the spectral shape from XRT) and green triangles (using the spectral shape from the stacked BAT analysis over the time interval MJD 56854.5–MJD 56872.5), the binned X-ray spectra from XRT by the blue circles, the optical-UV observations from KVA and UVOT by the pink squares, and the radio observations from Metsähovi by the green squares. Most of the data samples were selected from observations taken within 3 h of each other. For MJD 56861 and MJD 56863 there were no Swift observations taken within the same night of the MAGIC observations, and we depicted the spectra (UVOT, XRT, and BAT) from the night before and the night after with gray symbols. Upper limits are shown as open symbols. See text in Sect. 4 for further details.
Current usage metrics show cumulative count of Article Views (full-text article views including HTML views, PDF and ePub downloads, according to the available data) and Abstracts Views on Vision4Press platform.
Data correspond to usage on the plateform after 2015. The current usage metrics is available 48-96 hours after online publication and is updated daily on week days.
Initial download of the metrics may take a while.