Fig. 6.
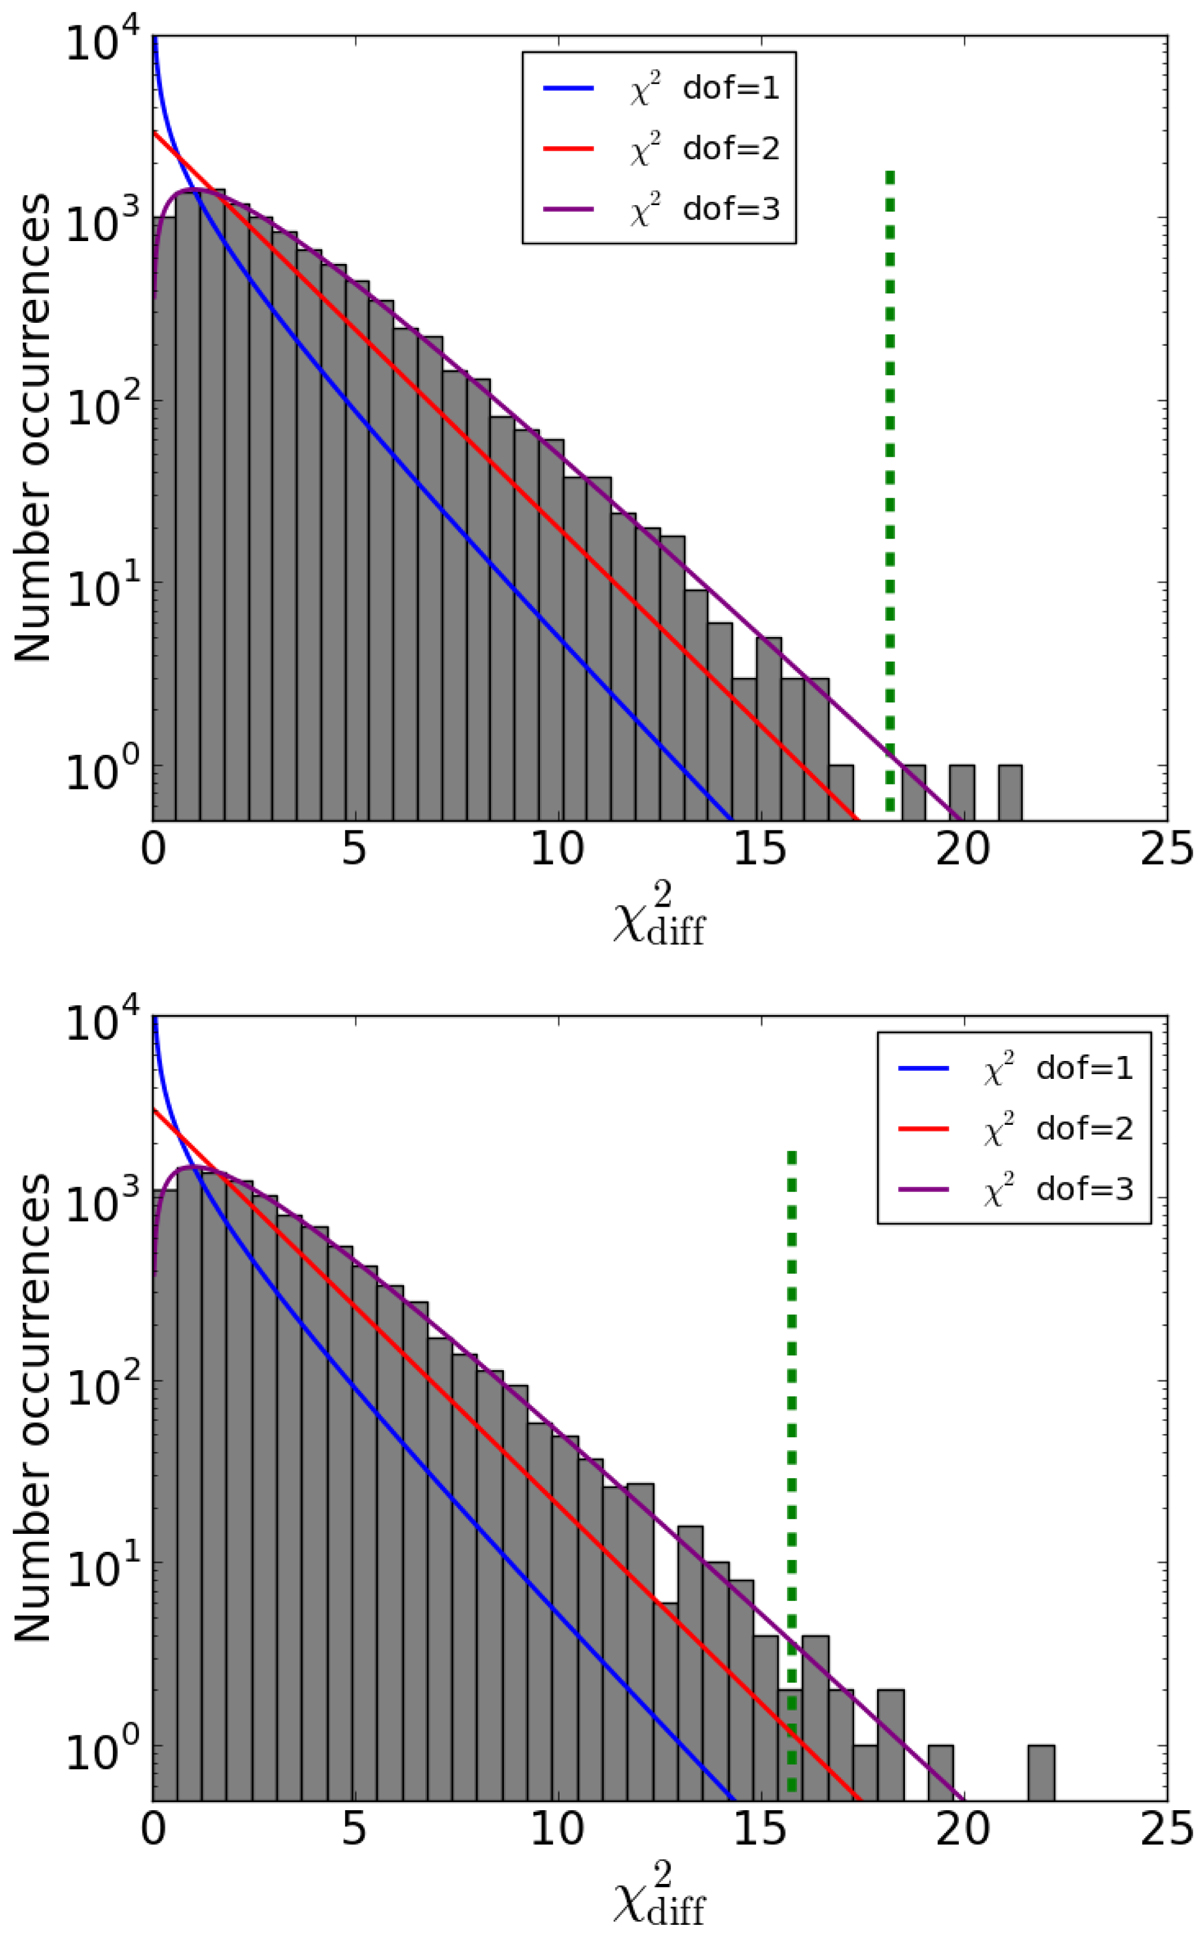
Distributions of ![]() values (null distribution of the LRT statistic) obtained from a Monte Carlo test that uses 10 000 simulated spectra to compare a baseline model (null hypothesis) parameterized with an LP function, and a narrow-feature model parameterized with an LP+EP function. Top panel: results derived with the observed VHE spectrum; bottom panel: results obtained with the EBL-corrected VHE spectrum. The green dashed line indicates the
values (null distribution of the LRT statistic) obtained from a Monte Carlo test that uses 10 000 simulated spectra to compare a baseline model (null hypothesis) parameterized with an LP function, and a narrow-feature model parameterized with an LP+EP function. Top panel: results derived with the observed VHE spectrum; bottom panel: results obtained with the EBL-corrected VHE spectrum. The green dashed line indicates the ![]() (LRTdata) obtained when comparing the LP and LP+EP fit results on the spectral data from Fig. 5. The blue, red, and purple solid lines depict the nominal χ2 distribution for 1, 2, and 3 degrees of freedom. See text in Sect. 3.4 for further details.
(LRTdata) obtained when comparing the LP and LP+EP fit results on the spectral data from Fig. 5. The blue, red, and purple solid lines depict the nominal χ2 distribution for 1, 2, and 3 degrees of freedom. See text in Sect. 3.4 for further details.
Current usage metrics show cumulative count of Article Views (full-text article views including HTML views, PDF and ePub downloads, according to the available data) and Abstracts Views on Vision4Press platform.
Data correspond to usage on the plateform after 2015. The current usage metrics is available 48-96 hours after online publication and is updated daily on week days.
Initial download of the metrics may take a while.