Fig. 5.
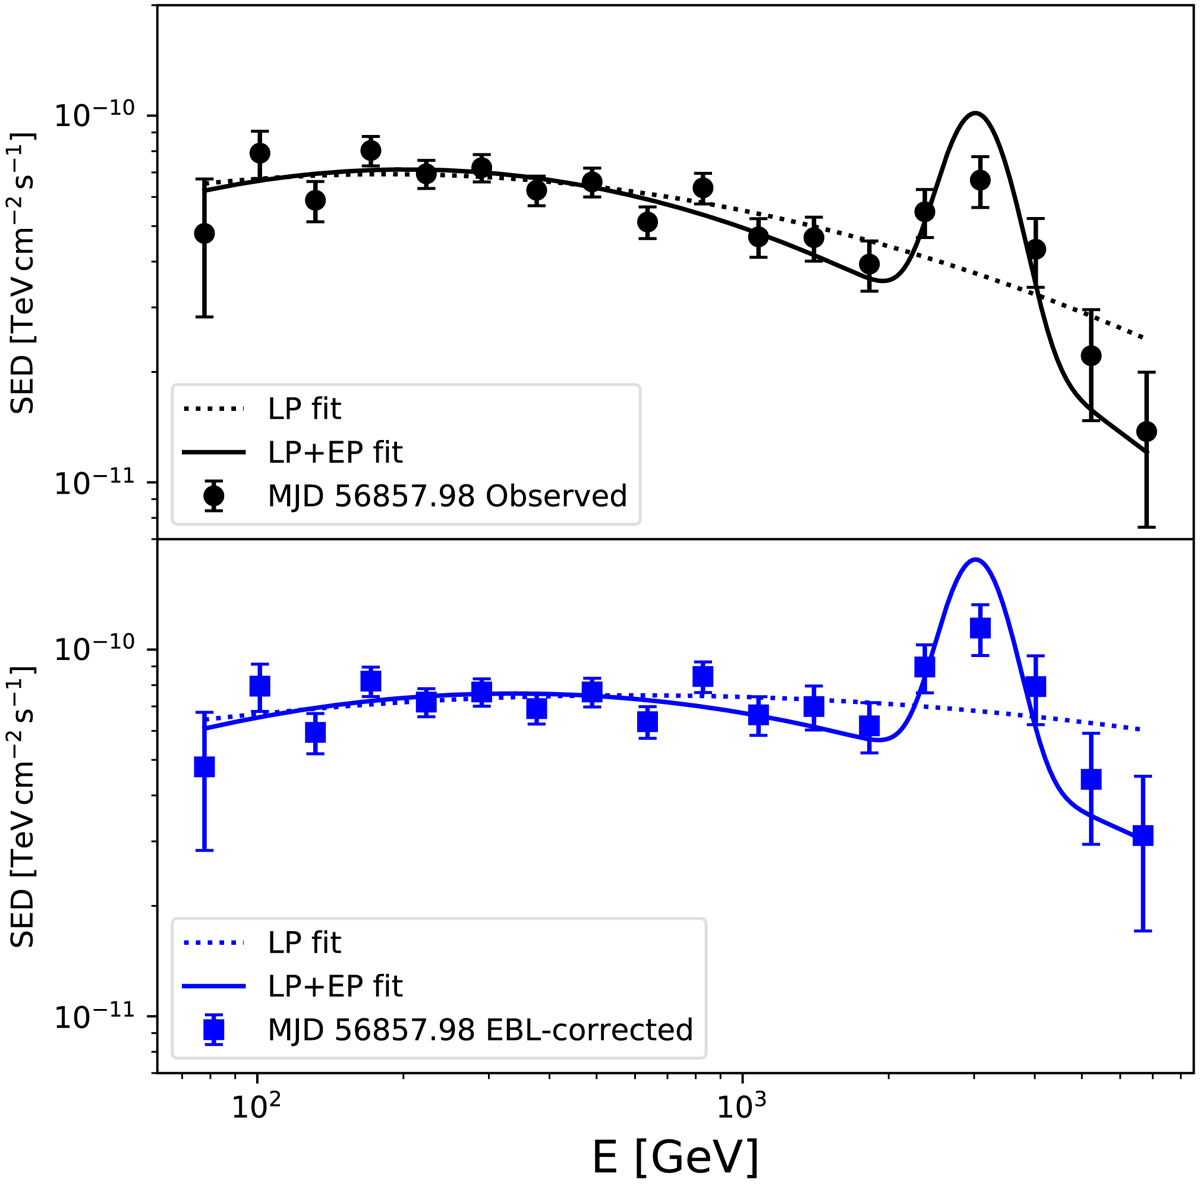
VHE SED from 2014 July 19 (MJD 56857.98) measured with the MAGIC telescopes with an analysis that uses 25% more bins in estimated energy with respect to that shown in Fig. 4. Black circles represent the observed SED, while the blue squares denote the same spectrum corrected for EBL absorption (using the model from Domínguez et al. 2011). In both panels the dotted lines depict fits with an LP function, while the solid lines depict the fits with an LP+EP function. The parameter values resulting from the spectral fits are reported in Table 4.
Current usage metrics show cumulative count of Article Views (full-text article views including HTML views, PDF and ePub downloads, according to the available data) and Abstracts Views on Vision4Press platform.
Data correspond to usage on the plateform after 2015. The current usage metrics is available 48-96 hours after online publication and is updated daily on week days.
Initial download of the metrics may take a while.