Fig. 4.
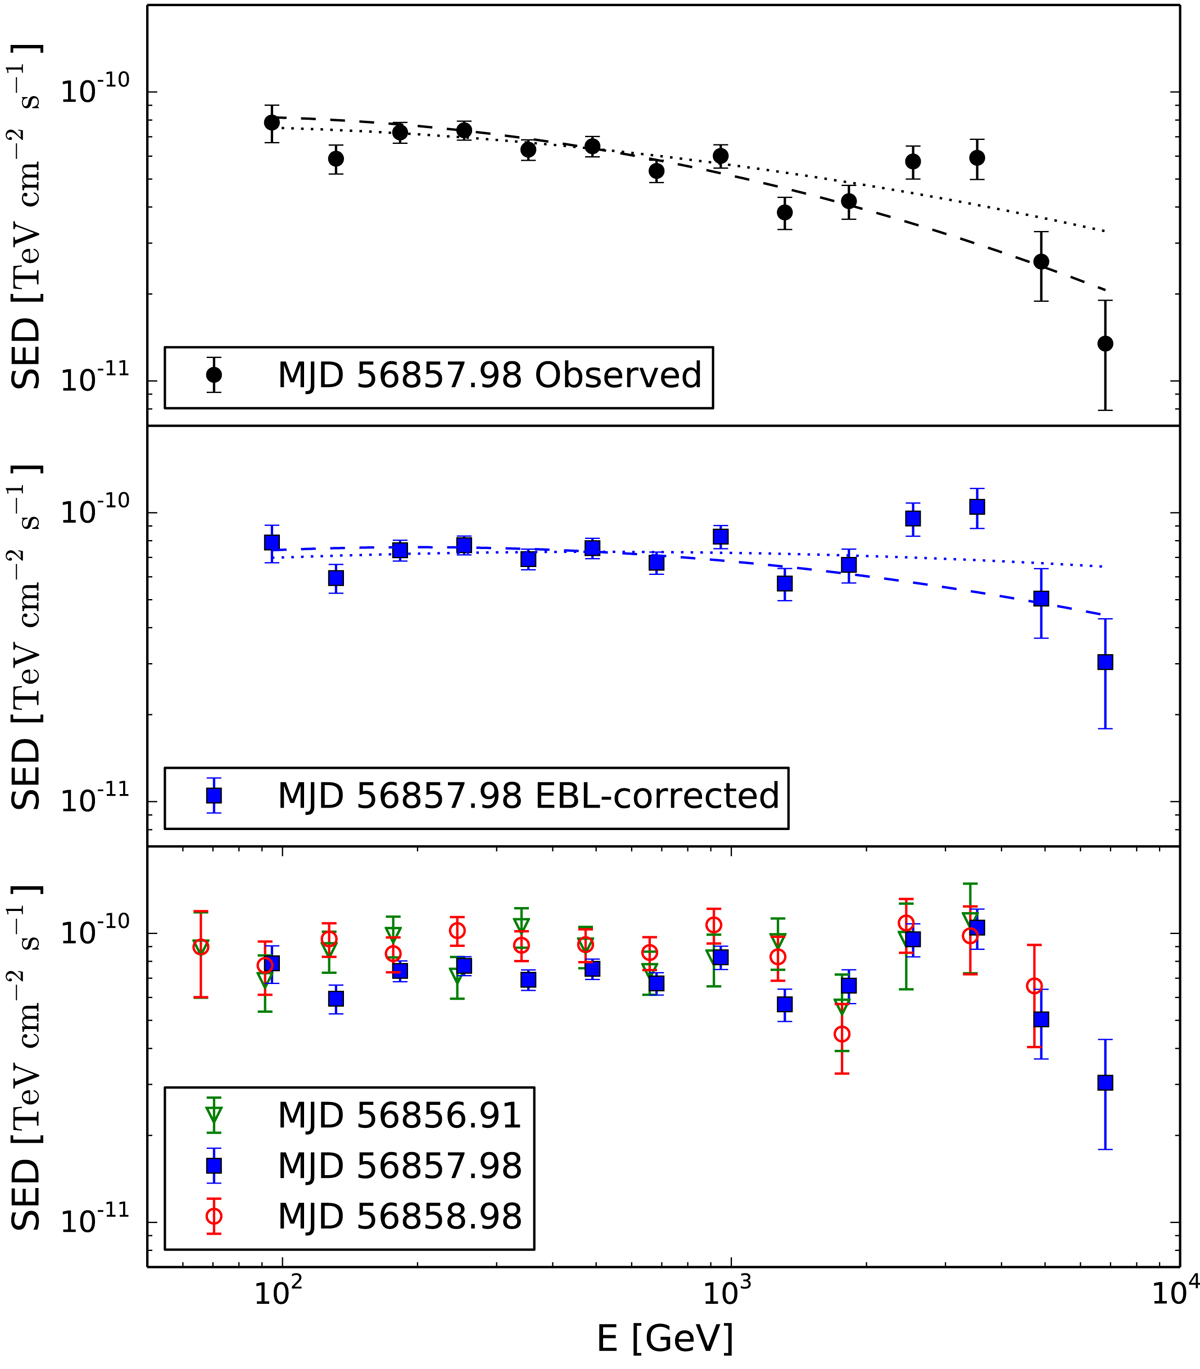
VHE SEDs from the MAGIC telescopes during the highest X-ray flux measured with Swift/XRT. Top and middle panels: black circles represent the observed SED from 2014 July 19 (MJD 56857.98), while the blue squares denote the same spectrum corrected for EBL absorption (using the model from Domínguez et al. 2011). In both panels the dotted lines depict the best LP fits (reported in Table 3), while the dashed lines show the best fits using data up to 1.5 TeV, and extrapolated beyond that energy (from the test reported in Table C.1). Bottom panel: VHE SEDs after EBL correction during three consecutive nights around 2014 July 19 (MJD 56857.98).
Current usage metrics show cumulative count of Article Views (full-text article views including HTML views, PDF and ePub downloads, according to the available data) and Abstracts Views on Vision4Press platform.
Data correspond to usage on the plateform after 2015. The current usage metrics is available 48-96 hours after online publication and is updated daily on week days.
Initial download of the metrics may take a while.