Fig. E.1.
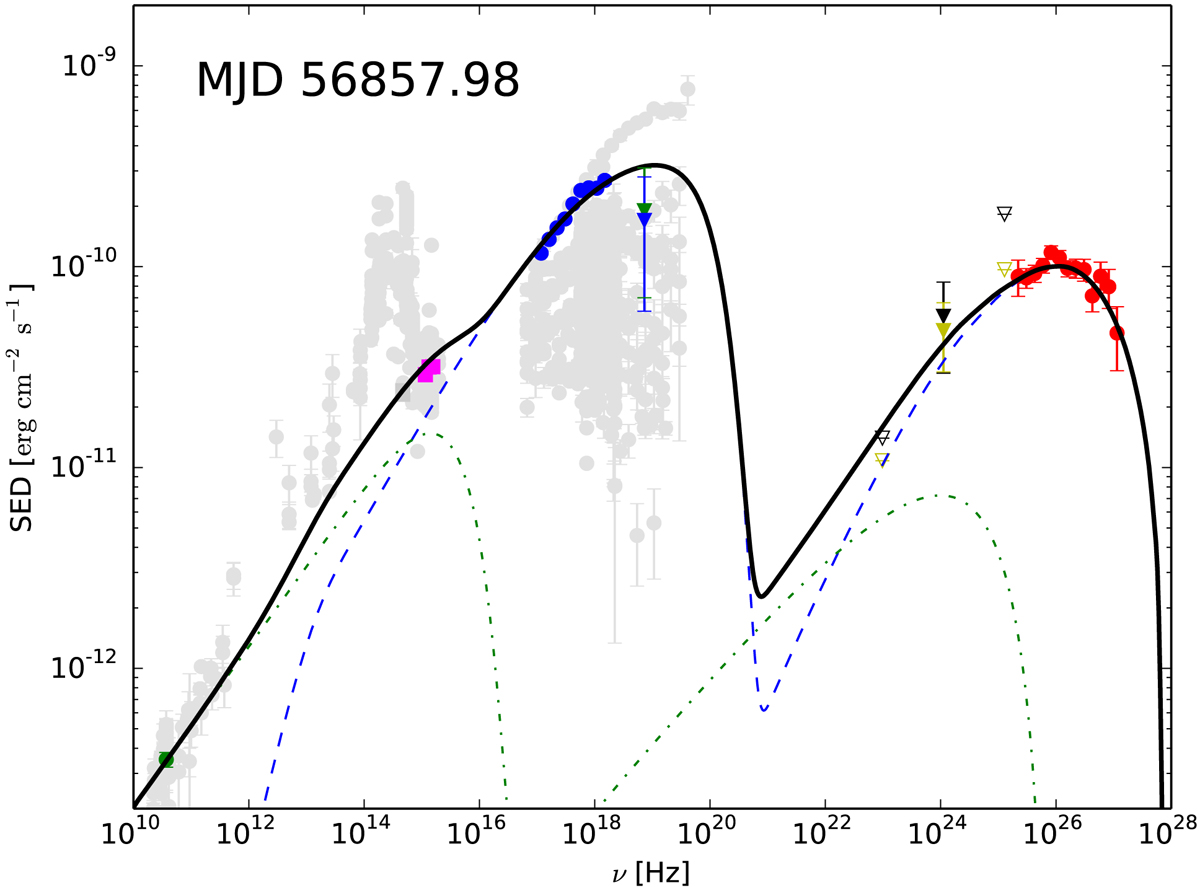
Broadband SED from 2014 July 21 (MJD 56859.97) where a two-zone SSC model has been used to describe the overall emission. One emitting region is responsible for the gamma-ray, X-ray and partially optical emission (dashed blue line). A second component explains the radio emission together with some optical emission (dashed green line). The colored spectral points represent the data sample from 56859.97. The gray spectral points represent the archival spectral points taken from the SED builder at SSDC. The peak emission at ∼1014−1015 Hz is due to the host galaxy contribution, which is not taken into account in our SSC model of the jet emission.
Current usage metrics show cumulative count of Article Views (full-text article views including HTML views, PDF and ePub downloads, according to the available data) and Abstracts Views on Vision4Press platform.
Data correspond to usage on the plateform after 2015. The current usage metrics is available 48-96 hours after online publication and is updated daily on week days.
Initial download of the metrics may take a while.