Fig. D.1.
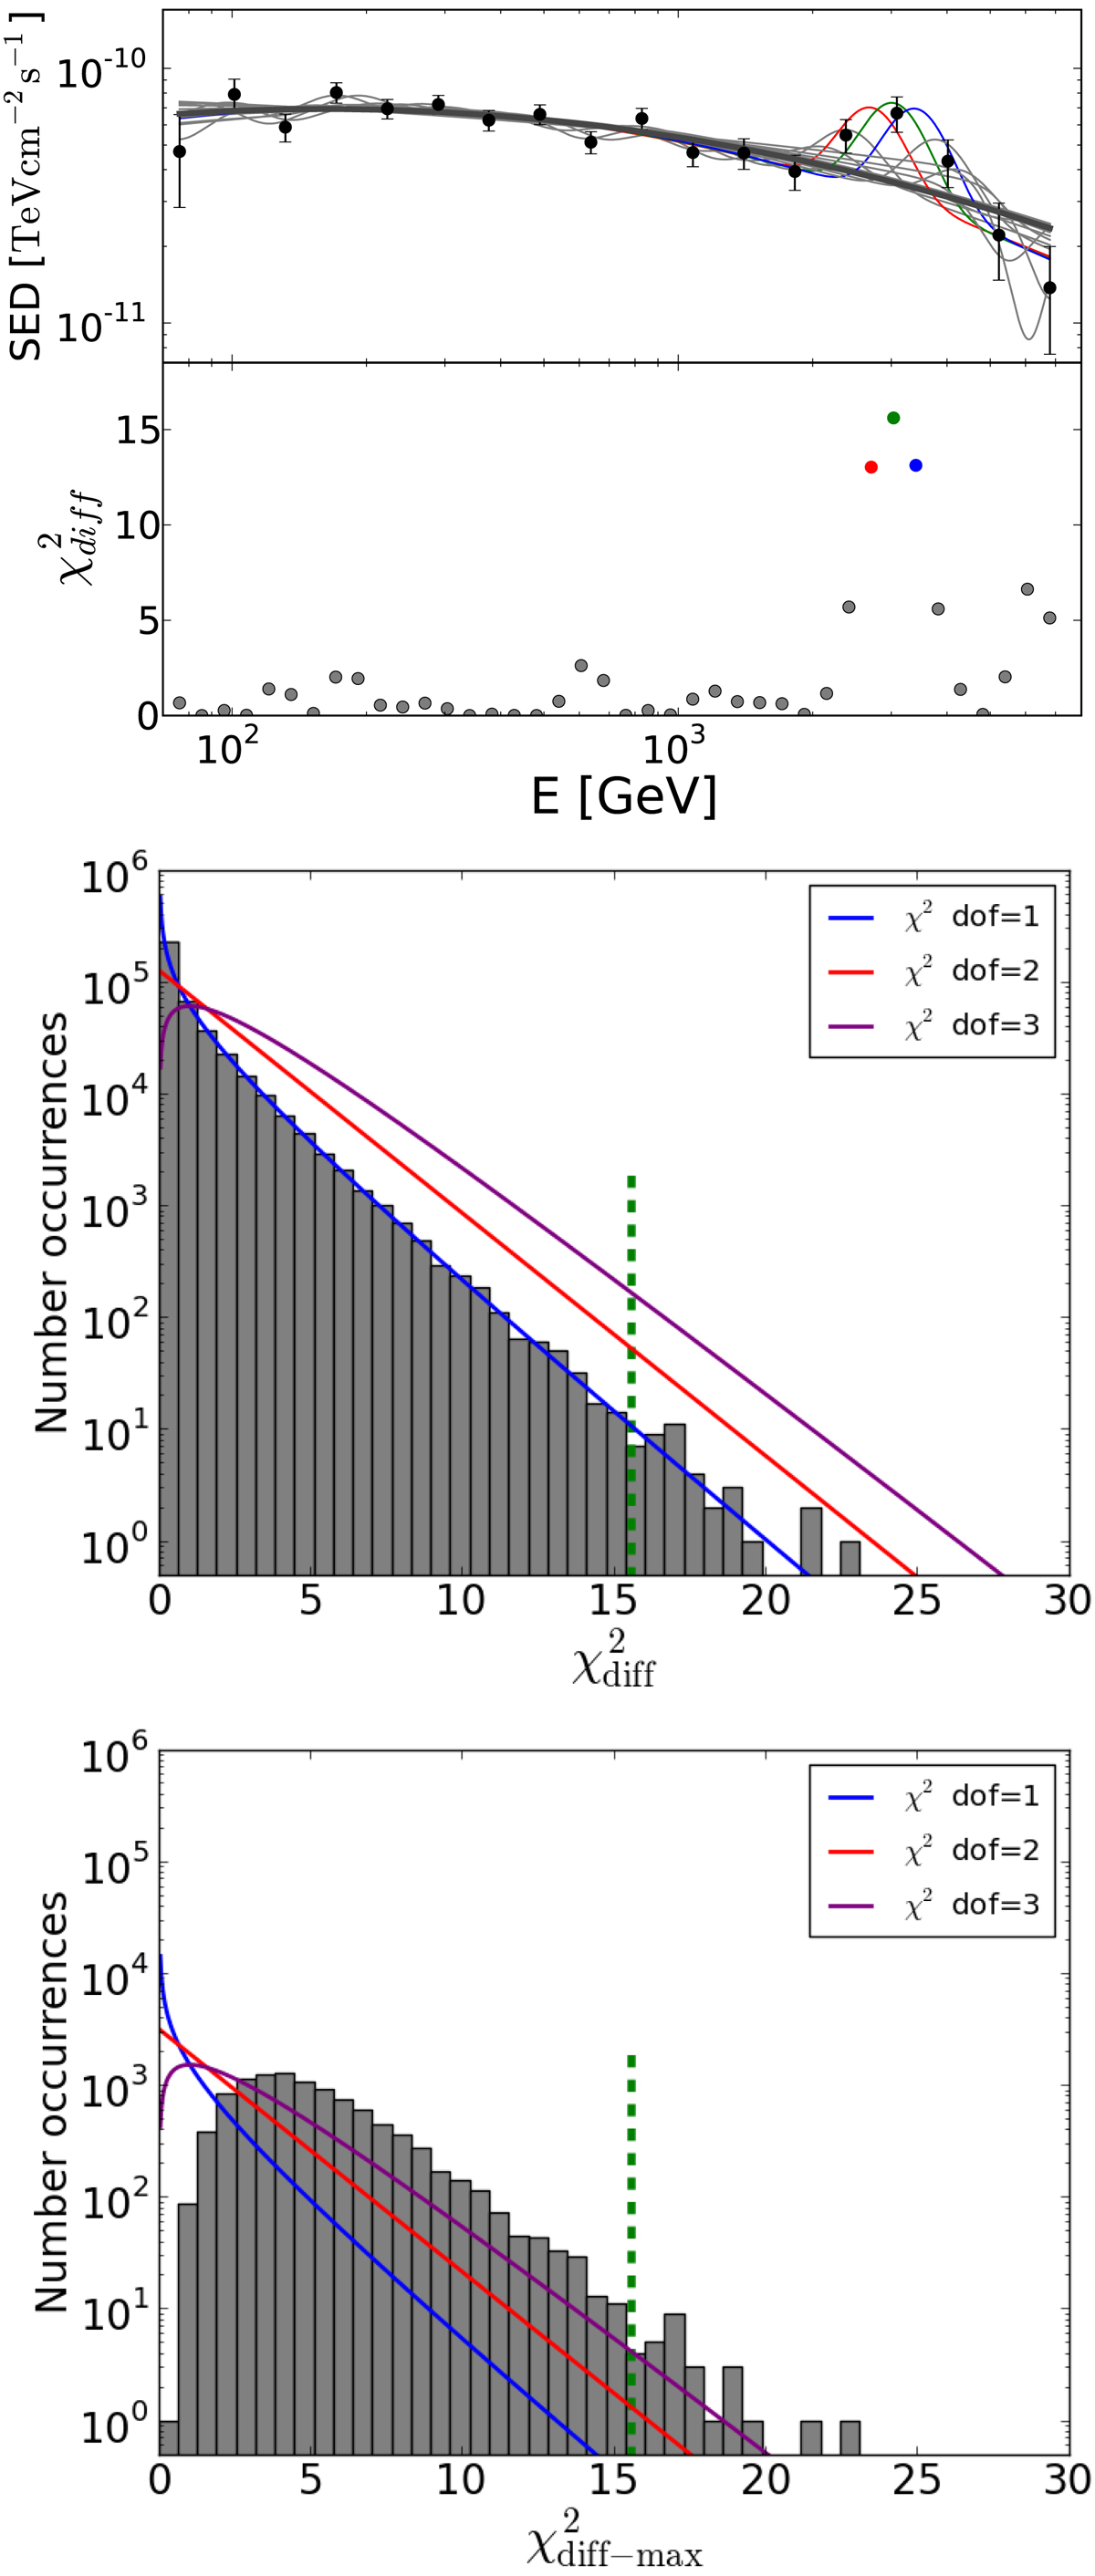
Results from the Monte Carlo simulations for the hypothesis of a narrow feature parameterized with an EP function with fixed curvature. First (top) panel: VHE gamma-ray spectrum from 2014 July 19 (MJD 56857.98), from Fig. 5, fitted with an LP function (thick dark gray curve), and also fitted with an LP plus an EP with β = 9.1, and centered at various energies from 0.08 TeV to 6.80 TeV in steps of 0.05 in base-10 logarithmic space (thin light gray lines). The difference in χ2 values (![]() ) is shown below the spectrum, using colors different from gray for cases with
) is shown below the spectrum, using colors different from gray for cases with ![]() . Second and third panels: resulting
. Second and third panels: resulting ![]() and
and ![]() distributions from the 104 simulated spectra. The green dashed line marks the
distributions from the 104 simulated spectra. The green dashed line marks the ![]() obtained for the measured spectrum and shown in the first panel, while the blue, red, and purple solid lines depict the expected χ2 distribution for 1, 2, and 3 degrees of freedom. See text in Appendix D for further details.
obtained for the measured spectrum and shown in the first panel, while the blue, red, and purple solid lines depict the expected χ2 distribution for 1, 2, and 3 degrees of freedom. See text in Appendix D for further details.
Current usage metrics show cumulative count of Article Views (full-text article views including HTML views, PDF and ePub downloads, according to the available data) and Abstracts Views on Vision4Press platform.
Data correspond to usage on the plateform after 2015. The current usage metrics is available 48-96 hours after online publication and is updated daily on week days.
Initial download of the metrics may take a while.