Fig. 10.
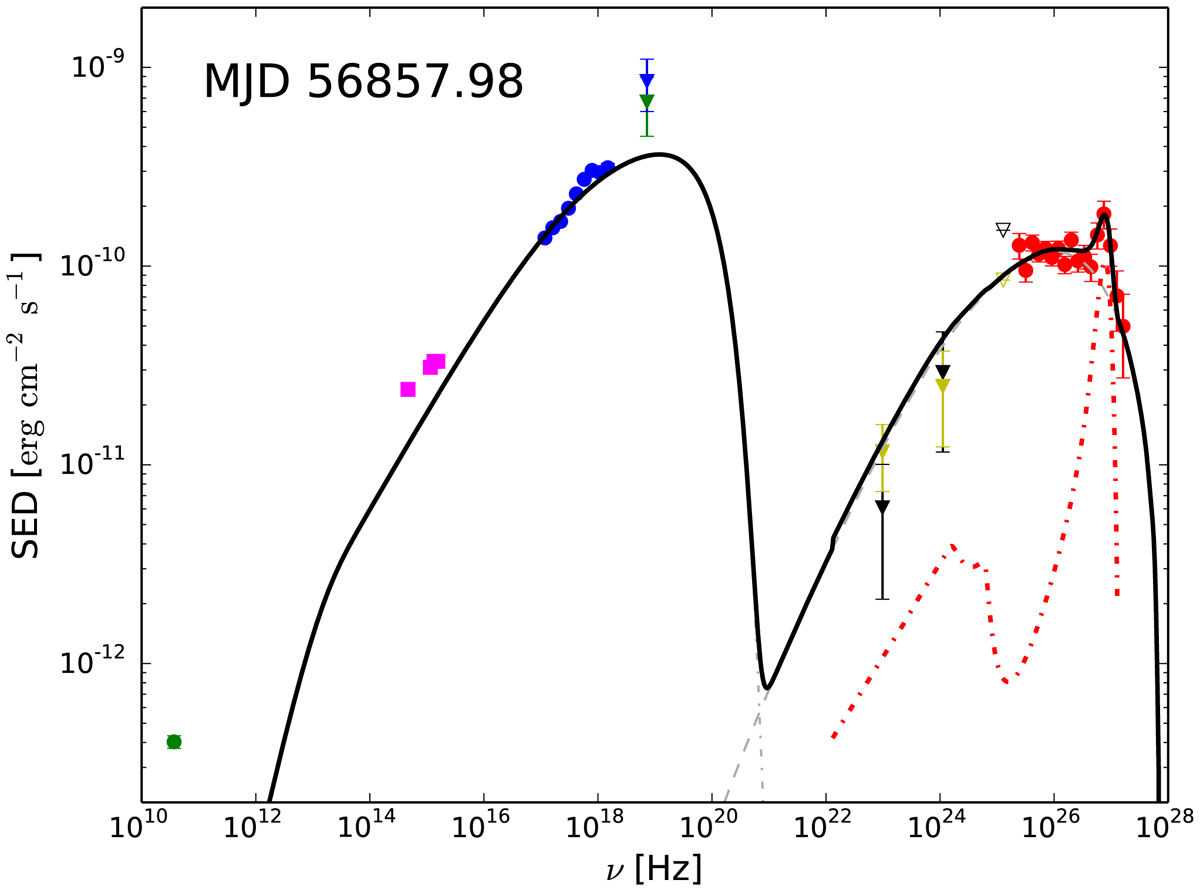
Broadband SED from 2014 July 19 (MJD 56857.98) modeled with one-zone SSC emission (gray dashed and gray dot-dashed lines) and the emission from an IC pair cascade (red dot-dashed line). The sum of the two components is depicted by the black solid line. The color-coding for the data points is the same as in Fig. 7. See text in Sect. 5.3 for further details.
Current usage metrics show cumulative count of Article Views (full-text article views including HTML views, PDF and ePub downloads, according to the available data) and Abstracts Views on Vision4Press platform.
Data correspond to usage on the plateform after 2015. The current usage metrics is available 48-96 hours after online publication and is updated daily on week days.
Initial download of the metrics may take a while.