Fig. 9.
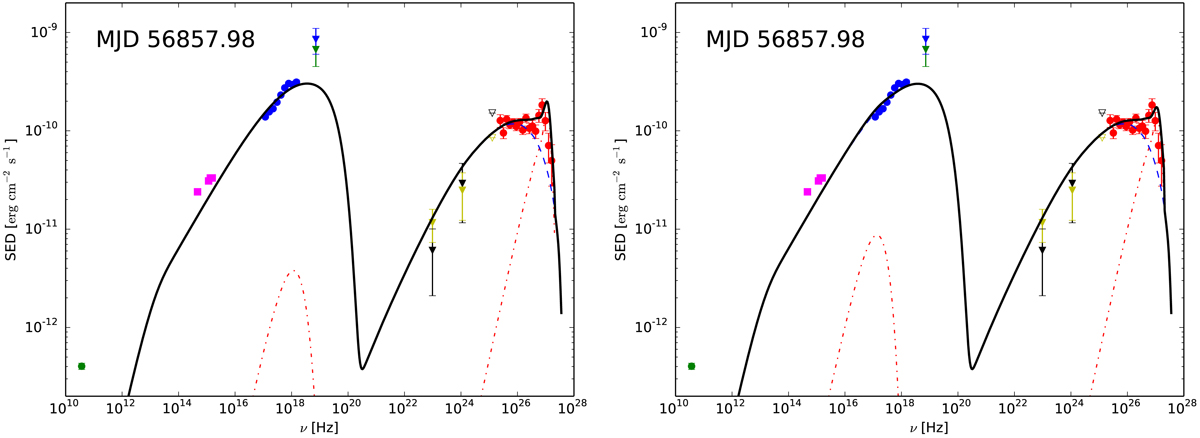
Broadband SED from 2014 July 19 (MJD 56857.98) described with a two-zone SSC model that assumes co-spatial (left panel) and non co-spatial (right panel) locations of the emitting regions within the jet. For both panels, the emission from the small region (with narrow EED) is denoted by the red dot-dashed line, while the sum of the emission from the two regions is depicted by the black solid line. The color-coding for the data points is the same as in Fig. 7. See text in Sect. 5.2 for further details.
Current usage metrics show cumulative count of Article Views (full-text article views including HTML views, PDF and ePub downloads, according to the available data) and Abstracts Views on Vision4Press platform.
Data correspond to usage on the plateform after 2015. The current usage metrics is available 48-96 hours after online publication and is updated daily on week days.
Initial download of the metrics may take a while.