Fig. 1.
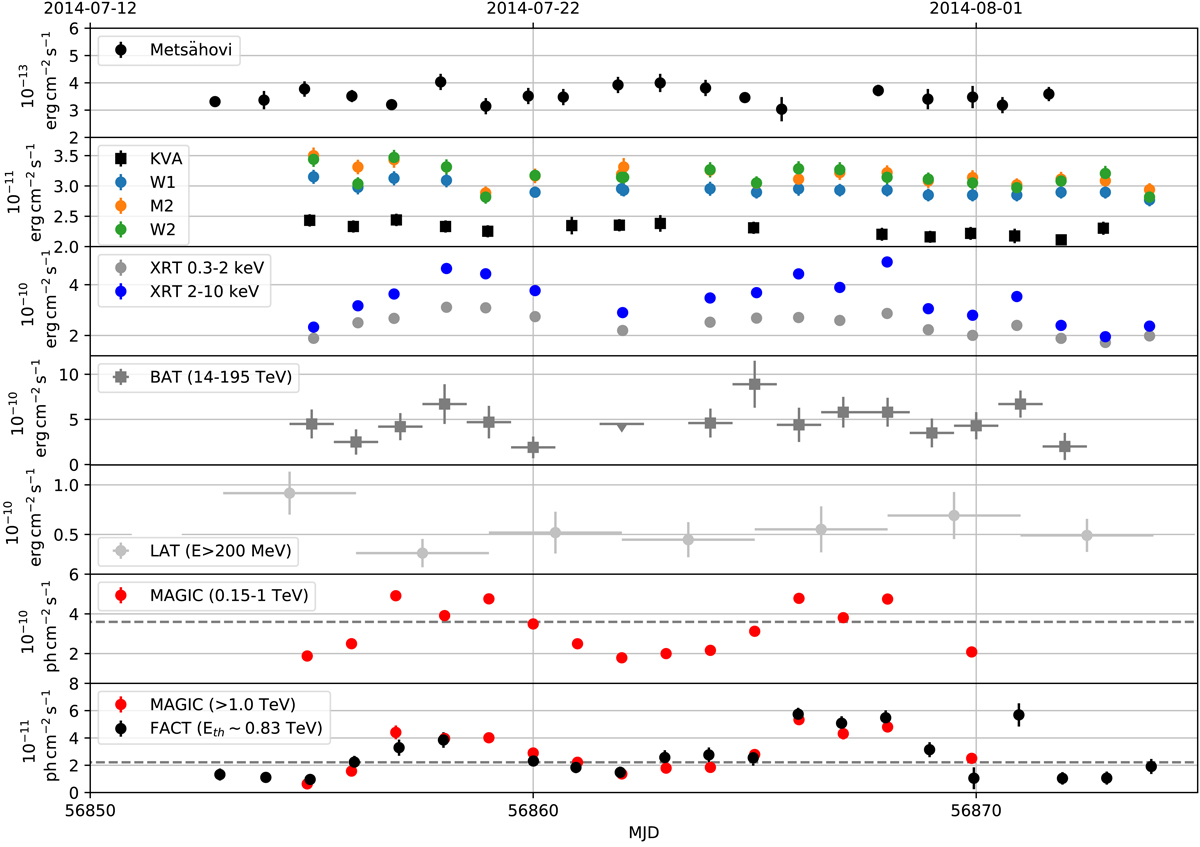
Multi-wavelength light curve for Mrk 501 during the highest X-ray activity measured with Swift/XRT to date. The correspondence between the instruments and the measured quantities is given in the legends. The horizontal dashed lines in the VHE light curves depict the flux of the Crab nebula reported in Aleksić et al. (2016b). For BAT, the daily fluxes were computed using the spectral shape from the time interval MJD 56854.5–MJD 56872.5 (see Sect. 2.4.1).
Current usage metrics show cumulative count of Article Views (full-text article views including HTML views, PDF and ePub downloads, according to the available data) and Abstracts Views on Vision4Press platform.
Data correspond to usage on the plateform after 2015. The current usage metrics is available 48-96 hours after online publication and is updated daily on week days.
Initial download of the metrics may take a while.