Fig. 2.
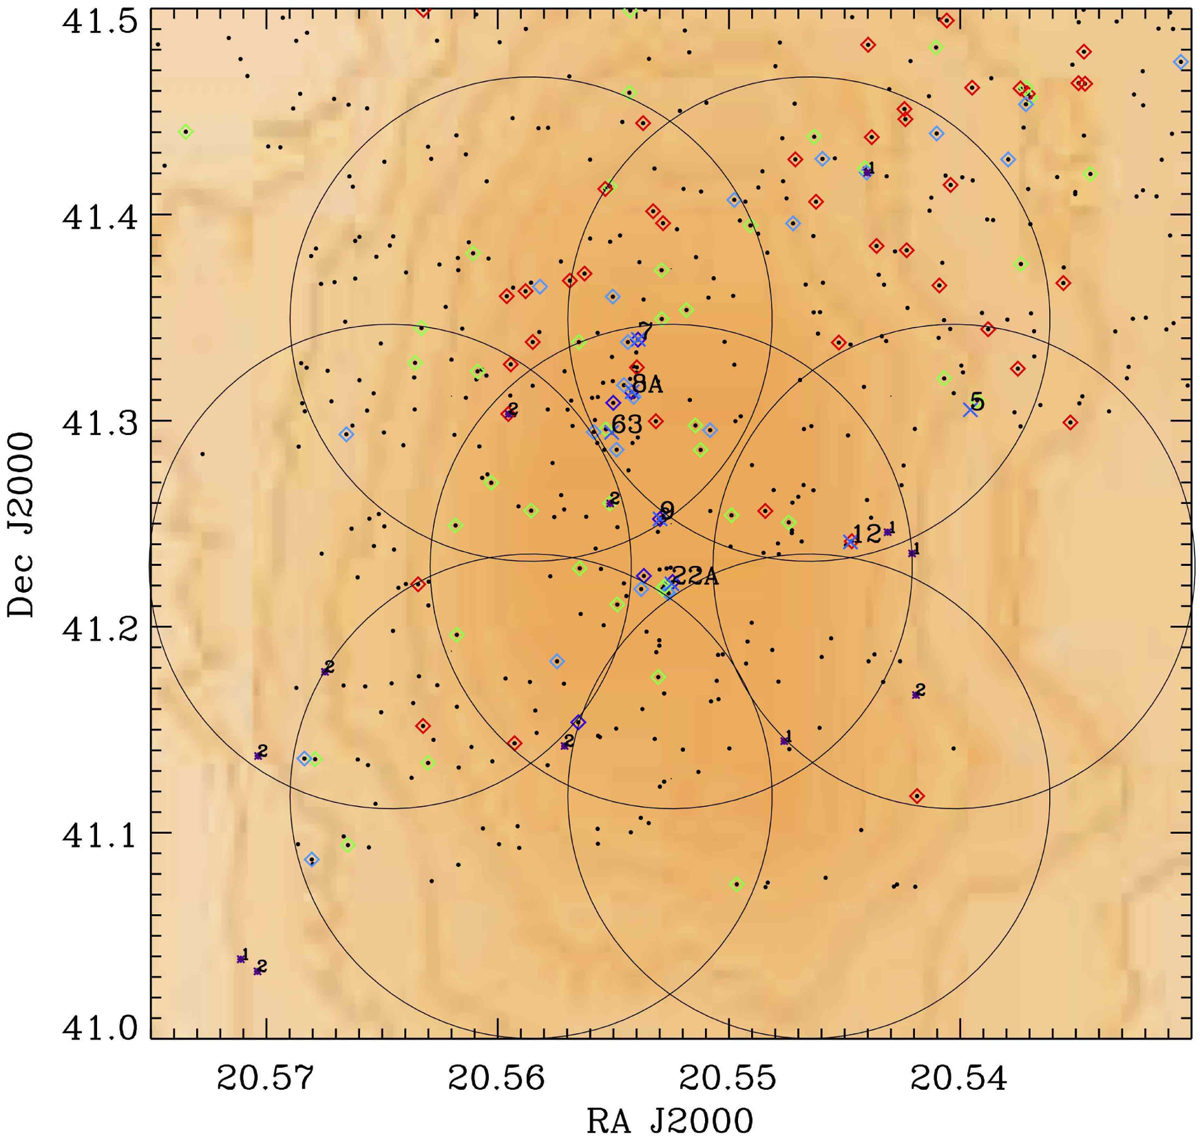
COBRaS positions for the seven L-band (21 cm) pointings imaged with e-MERLIN interferometer, based on the primary beam of the Lovell antenna shown as large circles. The background colour figure is the stellar density distribution from the 2MASS survey as given in Knödlseder (2000). The black dots represent OB stars from Massey & Thompson (1991), the coloured diamonds highlight OB binary systems from Kiminki et al. (2007), and the star symbols indicate massive stars taken from Comerón et al. (2002). The numbers identify some of the well-studied Cyg OB2 stars.
Current usage metrics show cumulative count of Article Views (full-text article views including HTML views, PDF and ePub downloads, according to the available data) and Abstracts Views on Vision4Press platform.
Data correspond to usage on the plateform after 2015. The current usage metrics is available 48-96 hours after online publication and is updated daily on week days.
Initial download of the metrics may take a while.