Fig. 10.
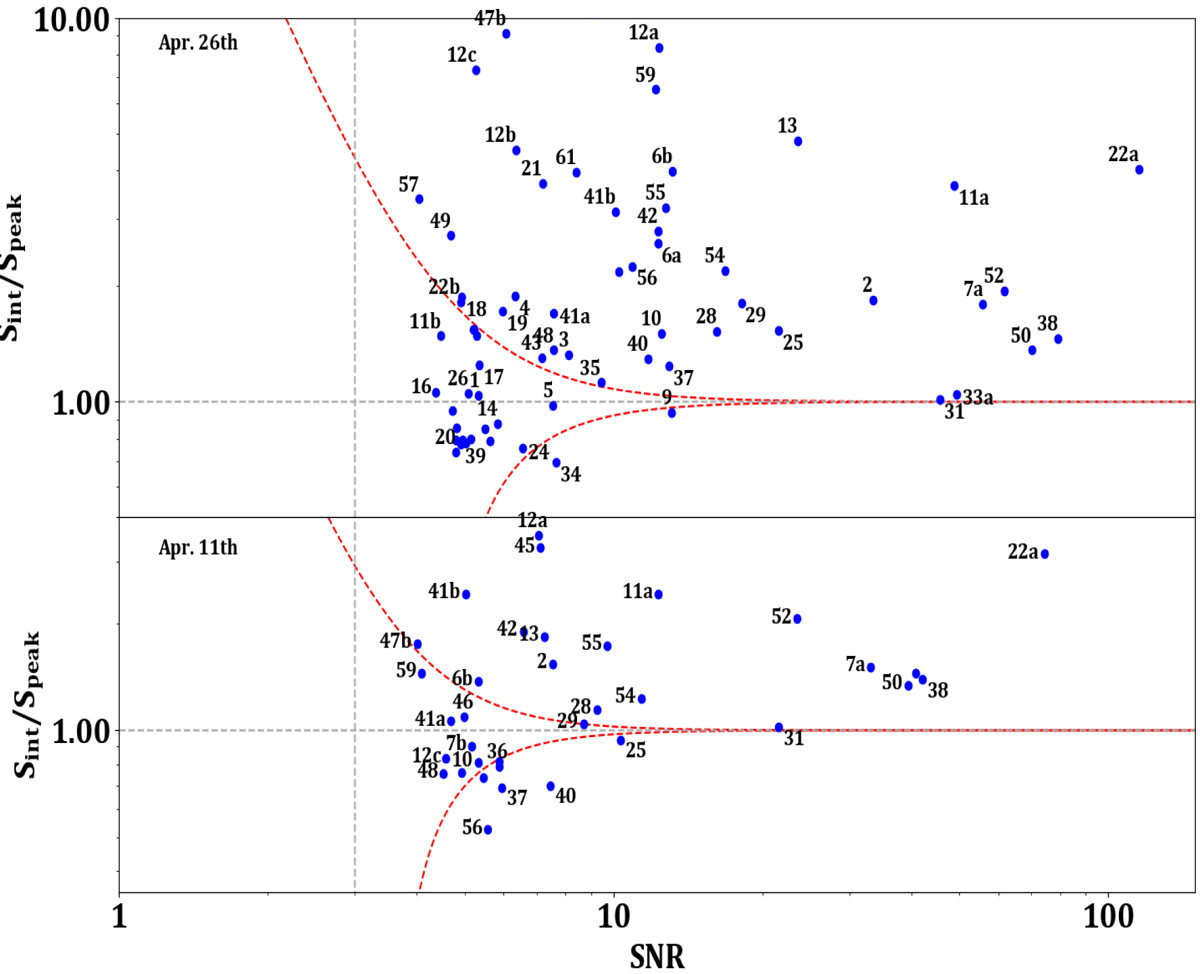
Ratio of the integrated flux density to the peak pixel flux (Sint/Speak; see Table A.3) plotted against the S/N of each of the CLASC sources for the April 26 (top) and April 11 (bottom) epochs. The red dotted lines represent the boundary between resolved (outside the red dotted lines) and unresolved (inside the red dotted lines) according to the criterion described above. Several CLASC IDs have been omitted for clarity.
Current usage metrics show cumulative count of Article Views (full-text article views including HTML views, PDF and ePub downloads, according to the available data) and Abstracts Views on Vision4Press platform.
Data correspond to usage on the plateform after 2015. The current usage metrics is available 48-96 hours after online publication and is updated daily on week days.
Initial download of the metrics may take a while.