Free Access
Fig. 5.
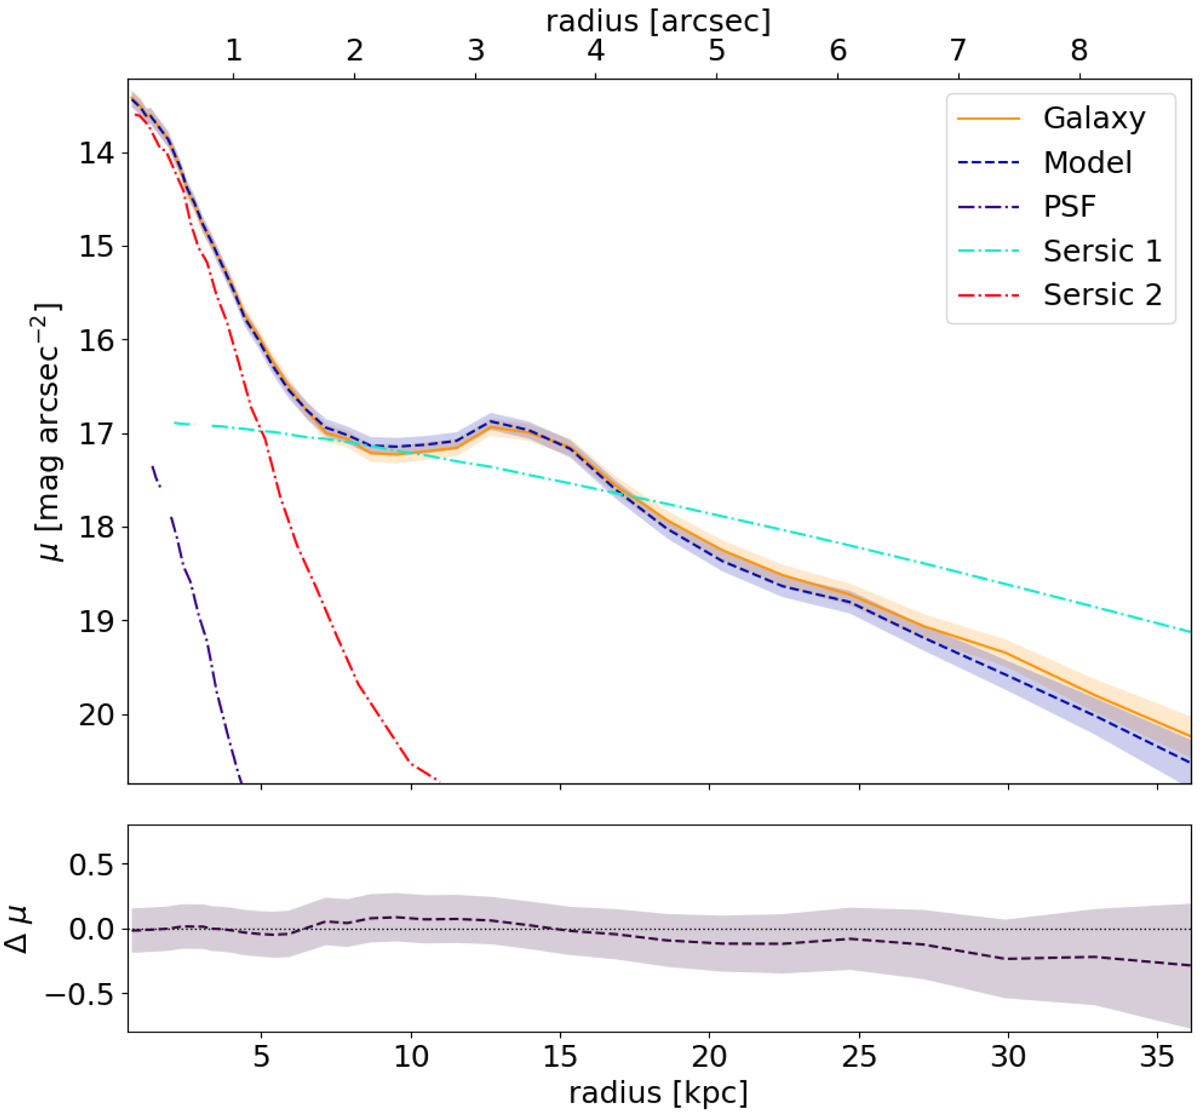
Radial surface brightness distribution of the system in Ks-band. Symbols and colours are explained in the plot and in the text. The shaded area describes the associated errors.
Current usage metrics show cumulative count of Article Views (full-text article views including HTML views, PDF and ePub downloads, according to the available data) and Abstracts Views on Vision4Press platform.
Data correspond to usage on the plateform after 2015. The current usage metrics is available 48-96 hours after online publication and is updated daily on week days.
Initial download of the metrics may take a while.