Fig. A.4.
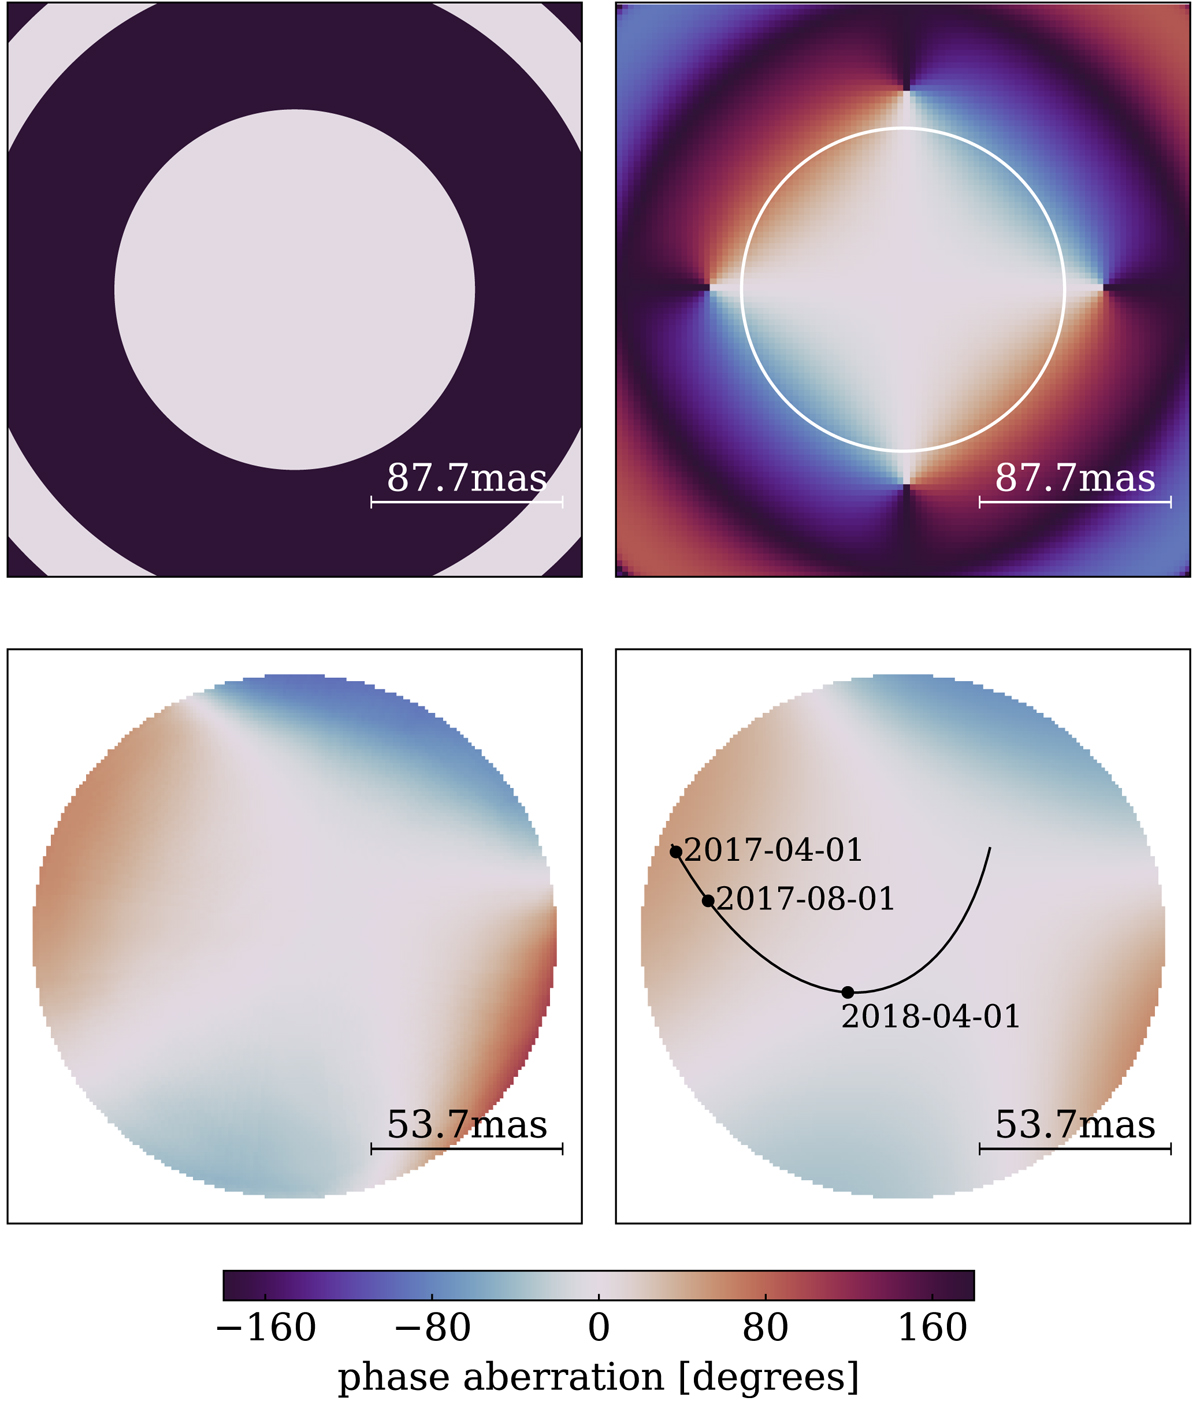
Two-dimensional phase maps used for correcting the effects of static aberrations in the binary fitting. Top row: compares simulations of a perfect Airy pattern (left) to a static astigmatism with 180 nm rms over the full pupil. The white circle in the top right panel shows the extent of the measured phase maps. One example for such a map is shown below, before (left) and after (right) applying a Gaussian kernel accounting for atmospheric smoothing. The black line in the lower right panel indicates the trace where S2 was located, as predicted by the orbit.
Current usage metrics show cumulative count of Article Views (full-text article views including HTML views, PDF and ePub downloads, according to the available data) and Abstracts Views on Vision4Press platform.
Data correspond to usage on the plateform after 2015. The current usage metrics is available 48-96 hours after online publication and is updated daily on week days.
Initial download of the metrics may take a while.