Fig. A.3.
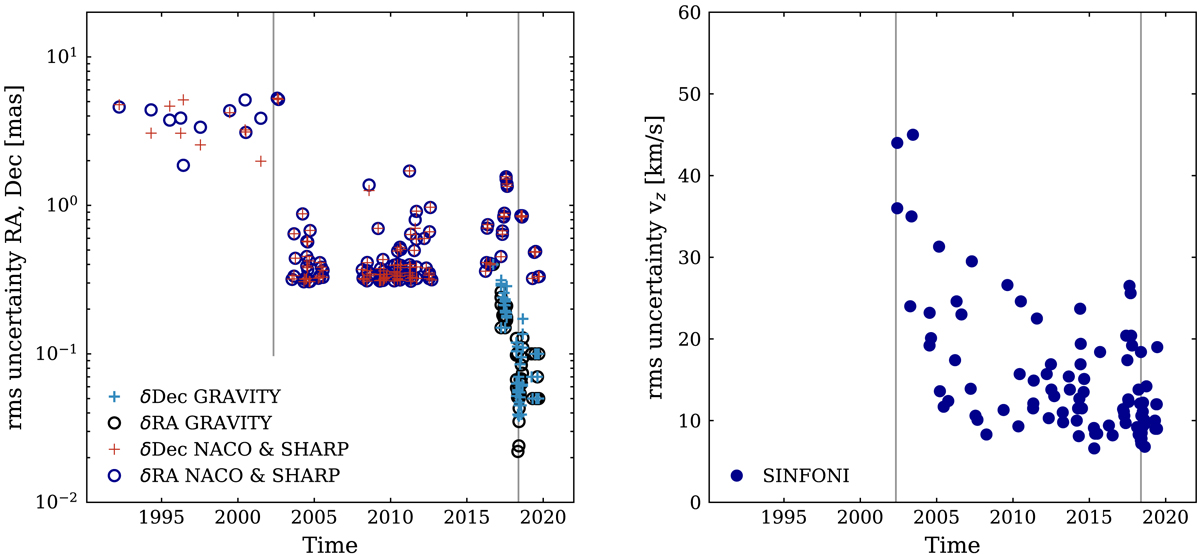
Astrometric (left) and spectroscopic (right) 1σ statistical measurement uncertainties of S2 over time. Left panel: almost 100-fold improvement in astrometric precision in RA and Dec, from the early period of speckle imagery with SHARP on the 3.5 m NTT (until 2001), then the AO imagery with NACO on the 8 m VLT (> 2002), and then, since 2016.7, the interferometric astrometry of GRAVITY combining all four 8 m telescopes of the VLT. The grey vertical lines are the two pericentre passages (2002.33 and 2018.38) covered by our data set.
Current usage metrics show cumulative count of Article Views (full-text article views including HTML views, PDF and ePub downloads, according to the available data) and Abstracts Views on Vision4Press platform.
Data correspond to usage on the plateform after 2015. The current usage metrics is available 48-96 hours after online publication and is updated daily on week days.
Initial download of the metrics may take a while.