Fig. 3.
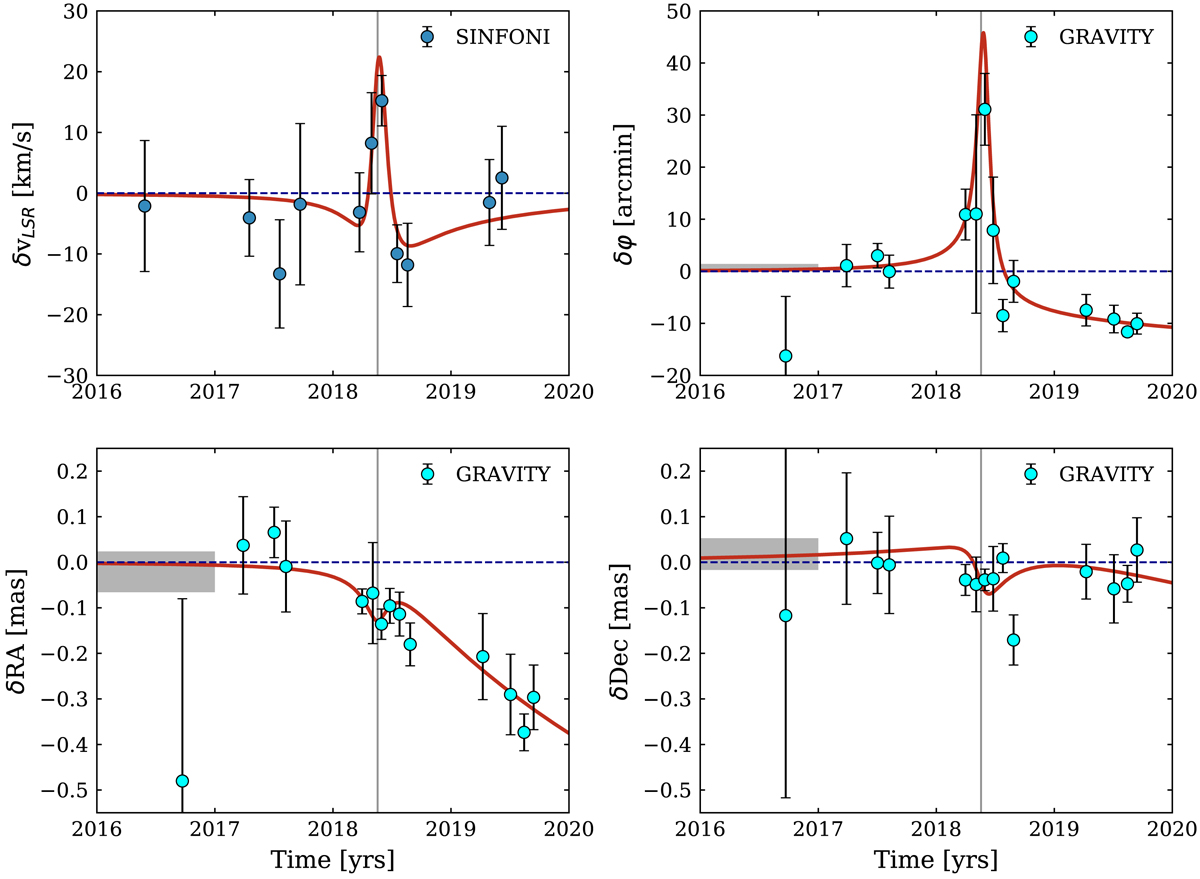
As Fig. 2, but now zooming into the critical 2018 pericentre residuals (best-fit fSP = 1.1 minus fSP = 0, with all other parameters fixed). Bottom two and top right panels: blue filled, open black circles (with 1σ uncertainties) are averages of GRAVITY data. The grey bar on the left denotes the constraints obtained from NACO imagery of S2 and Sgr A* flares on the location of the apocentre value (2010.35). Averages (and 1σ uncertainties) of the radial velocity residuals from SINFONI are open black, blue filled circles (top left). The residuals of the best-fitting fSP = 1.1 minus fSP = 0 curves are plotted in red.
Current usage metrics show cumulative count of Article Views (full-text article views including HTML views, PDF and ePub downloads, according to the available data) and Abstracts Views on Vision4Press platform.
Data correspond to usage on the plateform after 2015. The current usage metrics is available 48-96 hours after online publication and is updated daily on week days.
Initial download of the metrics may take a while.