Fig. 2.
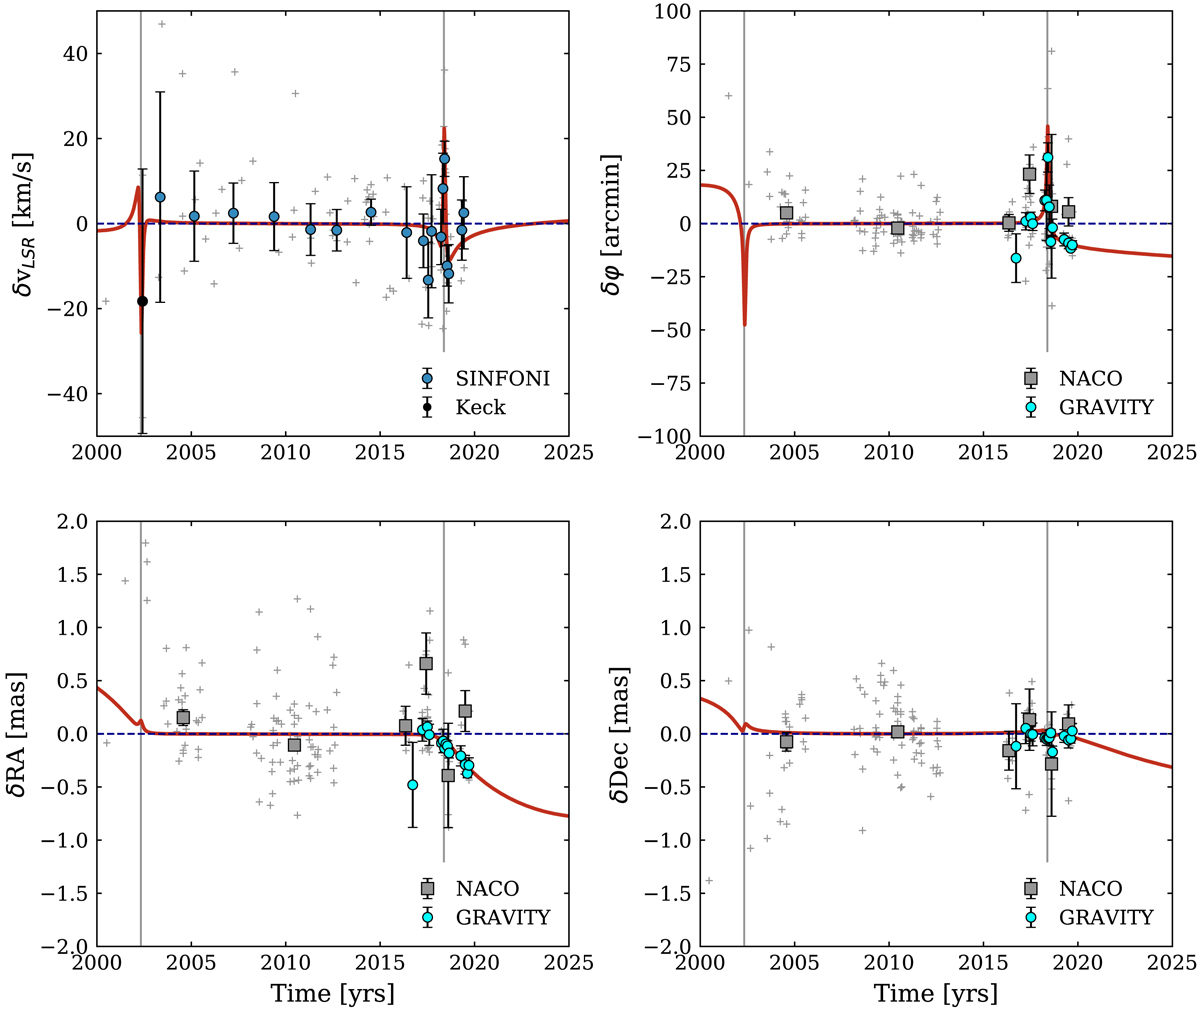
Posterior analysis of all data by fitting for fSP simultaneously with all other parameters. As in Fig. B.2, the bottom panels show the residuals in RA (left) and Dec (right) between the data and the best-fitting GR (thick red curve, fSP = 1.1), relative to the same orbit for fSP = 0 (Newton, plus Rømer effect, plus SRT, plus RS). Grey crosses denote individual NACO or SINFONI data, cyan filled black circles show averaged GRAVITY data, and grey rectangles denote averages of the NACO data. Top right panel: same for δφ, and top left panel: for δvz. Blue filled black circles are averages of the SINFONI residuals, with all residuals shown as grey crosses. The best fit (red curve) including the flare data (Fig. 1) has fSP = 1.1, with a 1σ uncertainty of 0.19. The overall reduced ![]() of this fit is 1.5.
of this fit is 1.5.
Current usage metrics show cumulative count of Article Views (full-text article views including HTML views, PDF and ePub downloads, according to the available data) and Abstracts Views on Vision4Press platform.
Data correspond to usage on the plateform after 2015. The current usage metrics is available 48-96 hours after online publication and is updated daily on week days.
Initial download of the metrics may take a while.