Fig. D.2.
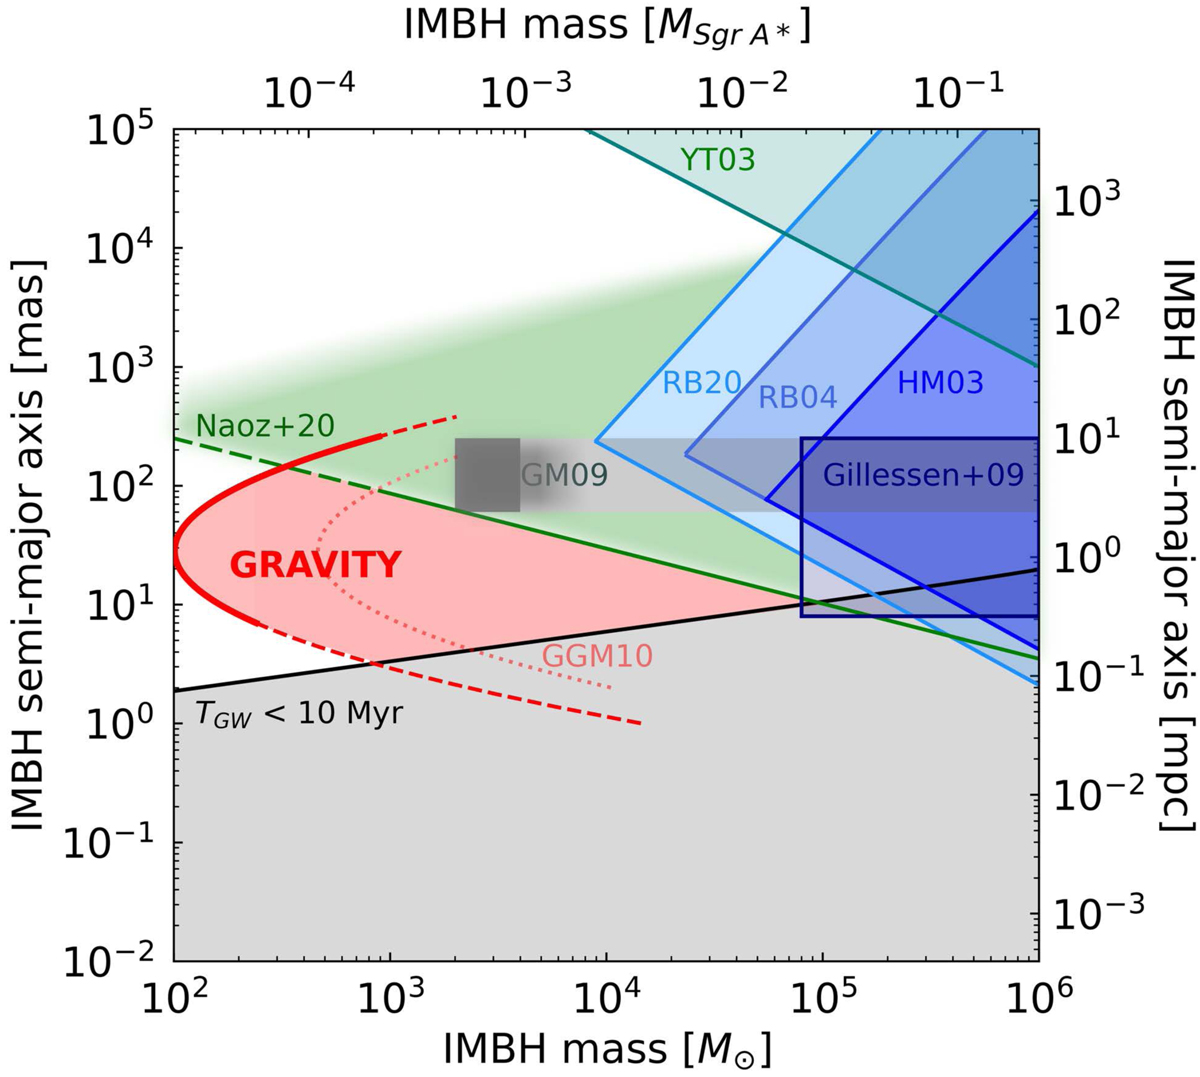
Limits on a second, intermediate mass black hole (IMBH), as a function of its mass and separation from Sgr A*. The shaded area is excluded observationally. Adapted from Gualandris & Merritt (2009). The blue shaded regions are due to the lack of observed motion of Sgr A* at radio wavelengths (Hansen & Milosavljević 2003, HM03). The data from Reid & Brunthaler (2004, RB04) and Reid & Brunthaler (2020, RB20) improve these limits. The upper bound results from the limit on the 3D velocity v3D ≲ 8 km s−1 (RB04) and ≲3 km s−1 (RB20). The lower bound results from the absence of short-period fluctuations in the position, with limits of 1 mas and 0.5 mas in RB04 and RB20. Yu & Tremaine (2003) set a limit from the ejection rates of hypervelocity stars if an IMBH were present in the GC (YT03). The bottom area is excluded because the gravitational wave inspiral time scale TGW would be < 10 Myr. Naoz et al. (2020) exclude the green shaded area by demanding that the S2 orbit be stable, taking into account resonant effects from the IMBH. Beyond the ranges given in the original work, the constraints get weaker (fading colour). The area labeled GM09 is excluded by Gualandris & Merritt (2009), who calculated the effect of an IMBH on the distribution of stellar orbits. Their original box extends to higher masses (shaded area to right). A first constraint from the orbit data of S2 was given in Gillessen et al. (2009a). Extending the orbital coverage in a simulation to the 2018 pericentre passage Gualandris et al. (2010) concluded that from a lack of extra residuals one should be able to exclude the area right of the dotted line (GGM10). GRAVITY improved the accuracy compared to these simulations by a factor 4.6, which moves the limit further to lower masses (red-shaded region). All but a 102 − 103 M⊙ IMBH inside or just outside of S2’s orbit is now excluded by the various measurements. This also excludes the configurations Merritt et al. (2009) found to be efficient in randomizing the S-star orbits.
Current usage metrics show cumulative count of Article Views (full-text article views including HTML views, PDF and ePub downloads, according to the available data) and Abstracts Views on Vision4Press platform.
Data correspond to usage on the plateform after 2015. The current usage metrics is available 48-96 hours after online publication and is updated daily on week days.
Initial download of the metrics may take a while.