Fig. D.1.
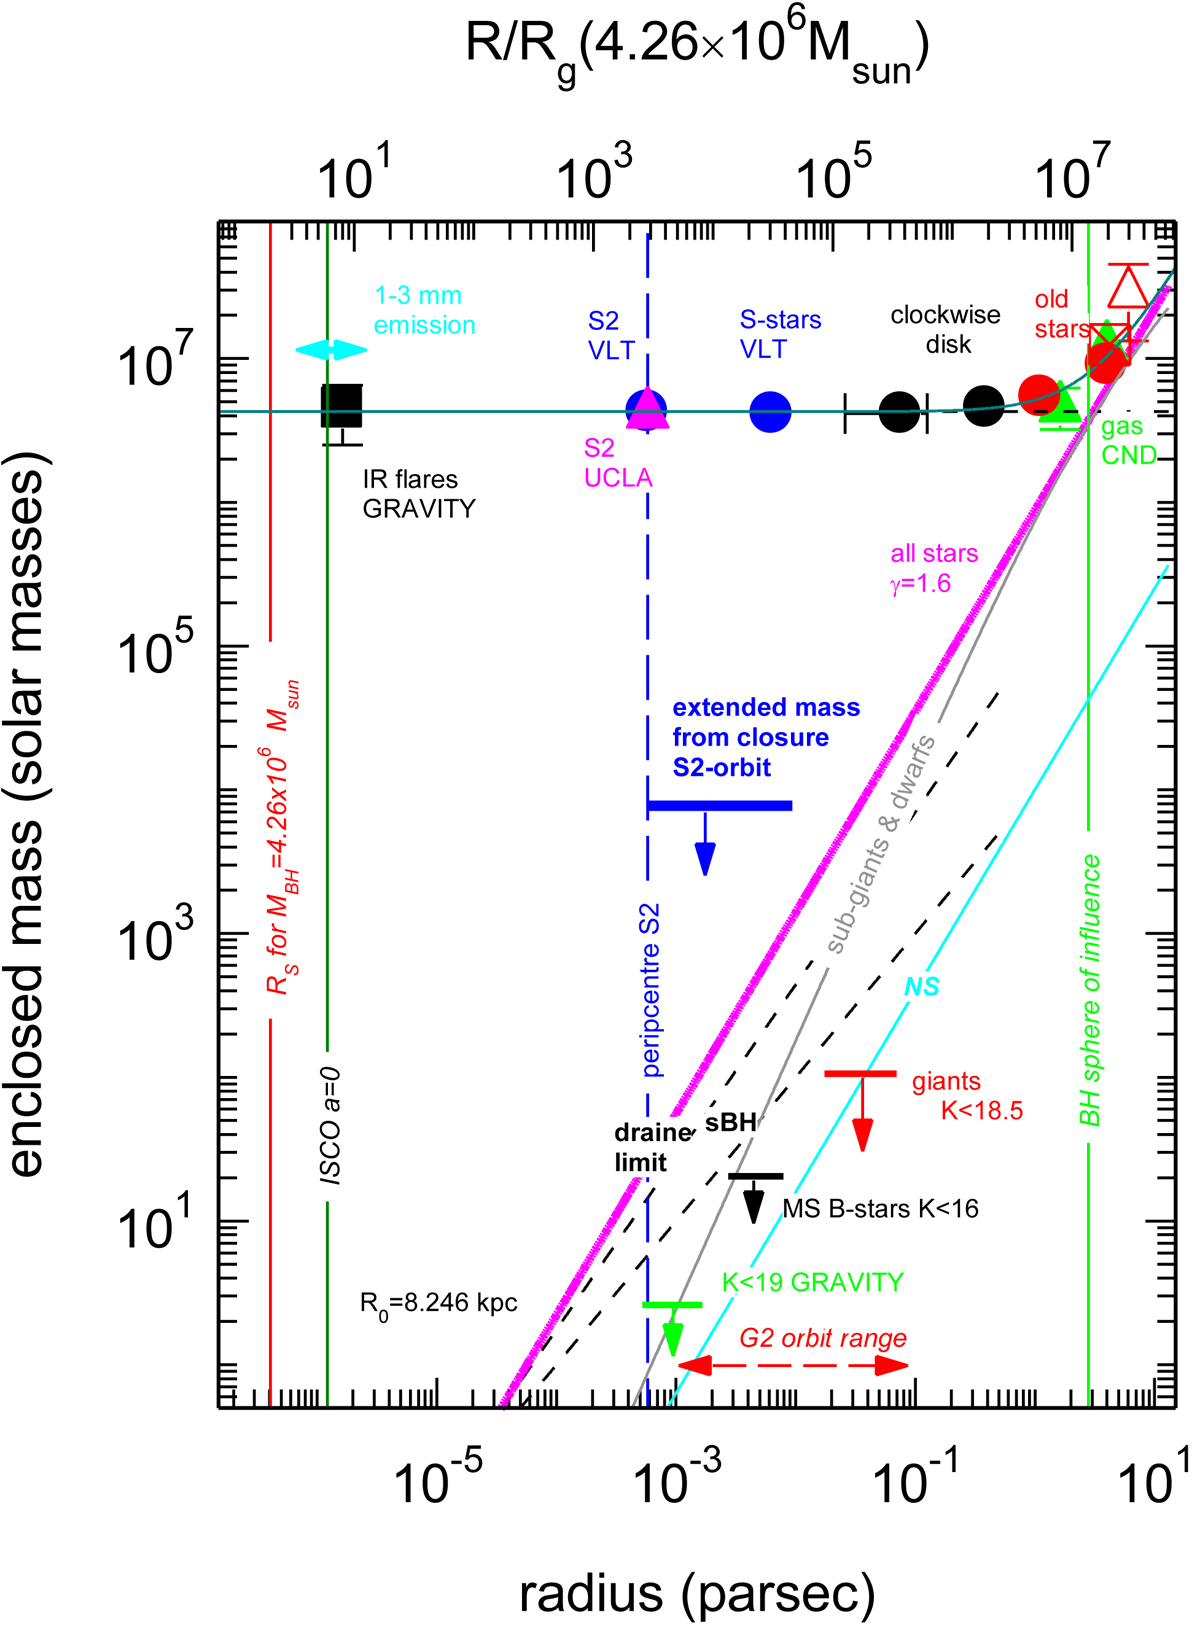
Constraints on the enclosed mass in the central 10 pc of the Galaxy. The blue crossed circle, the pink triangle, and the black crossed rectangles are estimates of the enclosed mass within the S2 orbit, other S-stars and the massive star discs (Paumard et al. 2006; Bartko et al. 2009; Yelda et al. 2014). The red filled circles, the red crossed rectangle, and red open triangles denote mass measurements from late-type stars. Green triangles are mass estimates from rotating gas in the circum-nuclear disc (see Genzel et al. 2010 for details). The filled black rectangle comes from the clockwise loop-motions of synchrotron near-infrared flares (GRAVITY Collaboration 2018b). The cyan double arrow denotes current VLBI estimates of the 3 mm size of Sgr A* (Issaoun et al. 2019). The continuous magenta line shows the total mass from all stars and stellar remnants (Alexander 2017). The grey line marks the distribution of K < 18.5 sub-giants and dwarfs from Schödel et al. (2018). The black dashed lines and the cyan line indicate the distribution of stellar black holes and neutron stars from theoretical simulations of Alexander (2017) and Baumgardt et al. (2018), which span a range of roughly a factor 5. Red, black and green upper limits denote upper limits on giants, main-sequence B stars and K < 19 GRAVITY sources. The Schwarzschild radius of a 4.26 × 10⁶ M⊙ black hole and the innermost stable circular orbit radius for a non-spinning black hole are given by red vertical lines. The pericentre radius of S2 is the dashed vertical blue line and the sphere of influence of the black hole is given by the vertical green line. The blue horizontal line denotes the 2σ upper limit of any extended mass around Sgr A* obtained from the lack of retrograde precession in the S2 orbit (see text).
Current usage metrics show cumulative count of Article Views (full-text article views including HTML views, PDF and ePub downloads, according to the available data) and Abstracts Views on Vision4Press platform.
Data correspond to usage on the plateform after 2015. The current usage metrics is available 48-96 hours after online publication and is updated daily on week days.
Initial download of the metrics may take a while.