Fig. B.2.
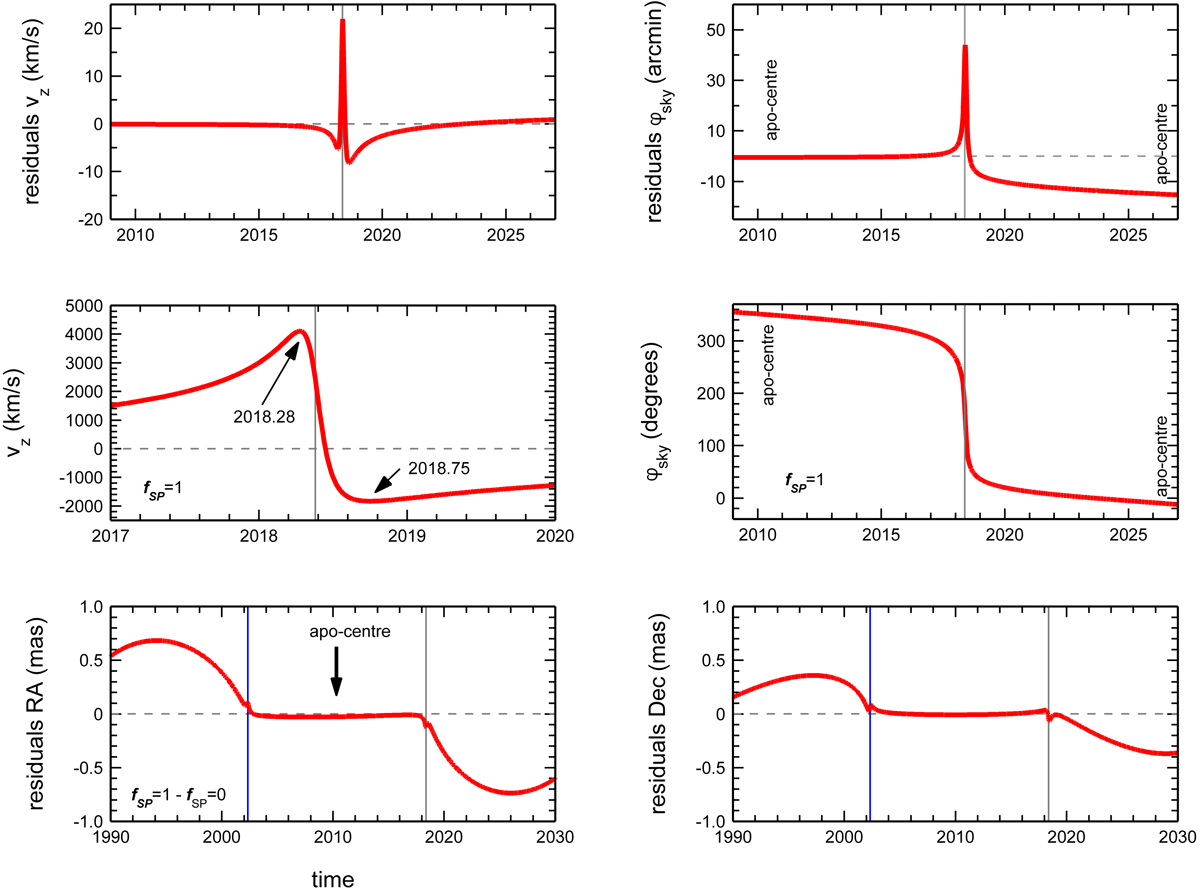
Theoretical expectations for the effect of the Schwarzschild precession on the orbit of the star S2. Here we took the best-fit parameters of the S2 orbit, and computed two model orbits, one for fSP = 0 (Newton, plus Rømer effect, plus SRT, plus RS), and one for fSP = 1 (Eq. (C.1)). The grey (2018.38) and blue (2002.34) vertical lines are the pericentre times. We arbitrarily set the precession angle of the SP orbit to 0 during apocentre 2010.35. Top panels: residuals of δvz (left) and δφ (right) between the fSP = 1 and fSP = 0 orbits. Bottom panels: same for δRA (left) and δDec (right). Middle panels: vz (left) and φ (right) as a function of time. Here, φ is the position angle of the star on the sky, φ = arctan(RA/Dec), running from 359° when the star is straight north, or north-west of centre, to 180° when it is straight south, to > 0° when it is just north-north east of centre. The most fundamental aspect of the precession is seen in the top right panel as a change in δφ by ≈14′ between two apocentres. Because the precession strongly depends on radius, the precession is very fast around pericentre (2018.38) in a highly elliptical orbit, so that within ≈1 year of pericentre ≈75% of the precession has occurred. To first order, the precession leads to a change in time when the star is found at a given angle φ on the sky, relative to the non-precessing orbit. Because the functional form of φ(t) is close to a step function, the differencing δφ(t) = φSP = 1(t)−φSP = 0(t) is close to a differentiation dφ/dt, which thus results in a sharp δ-function in the residuals δφ(t) near pericentre. In velocity space a similar effect occurs in the residuals as well, although vz(t) is not as symmetric in t relative to tperi. Finally in δRA and δDec (bottom panels), the effect of the precession results in a “kink” in the orbit coordinate time slope. Because of the variations in the foreshortening of the RA and Dec coordinates of the apocentre values of the δRA, δDec and δφ the SP = 1 vs. SP = 0 curves vary over time (Fig. B.1). The projected precession on the sky between the apocentres 2010.35 and 2026.5 is ≈14′.
Current usage metrics show cumulative count of Article Views (full-text article views including HTML views, PDF and ePub downloads, according to the available data) and Abstracts Views on Vision4Press platform.
Data correspond to usage on the plateform after 2015. The current usage metrics is available 48-96 hours after online publication and is updated daily on week days.
Initial download of the metrics may take a while.