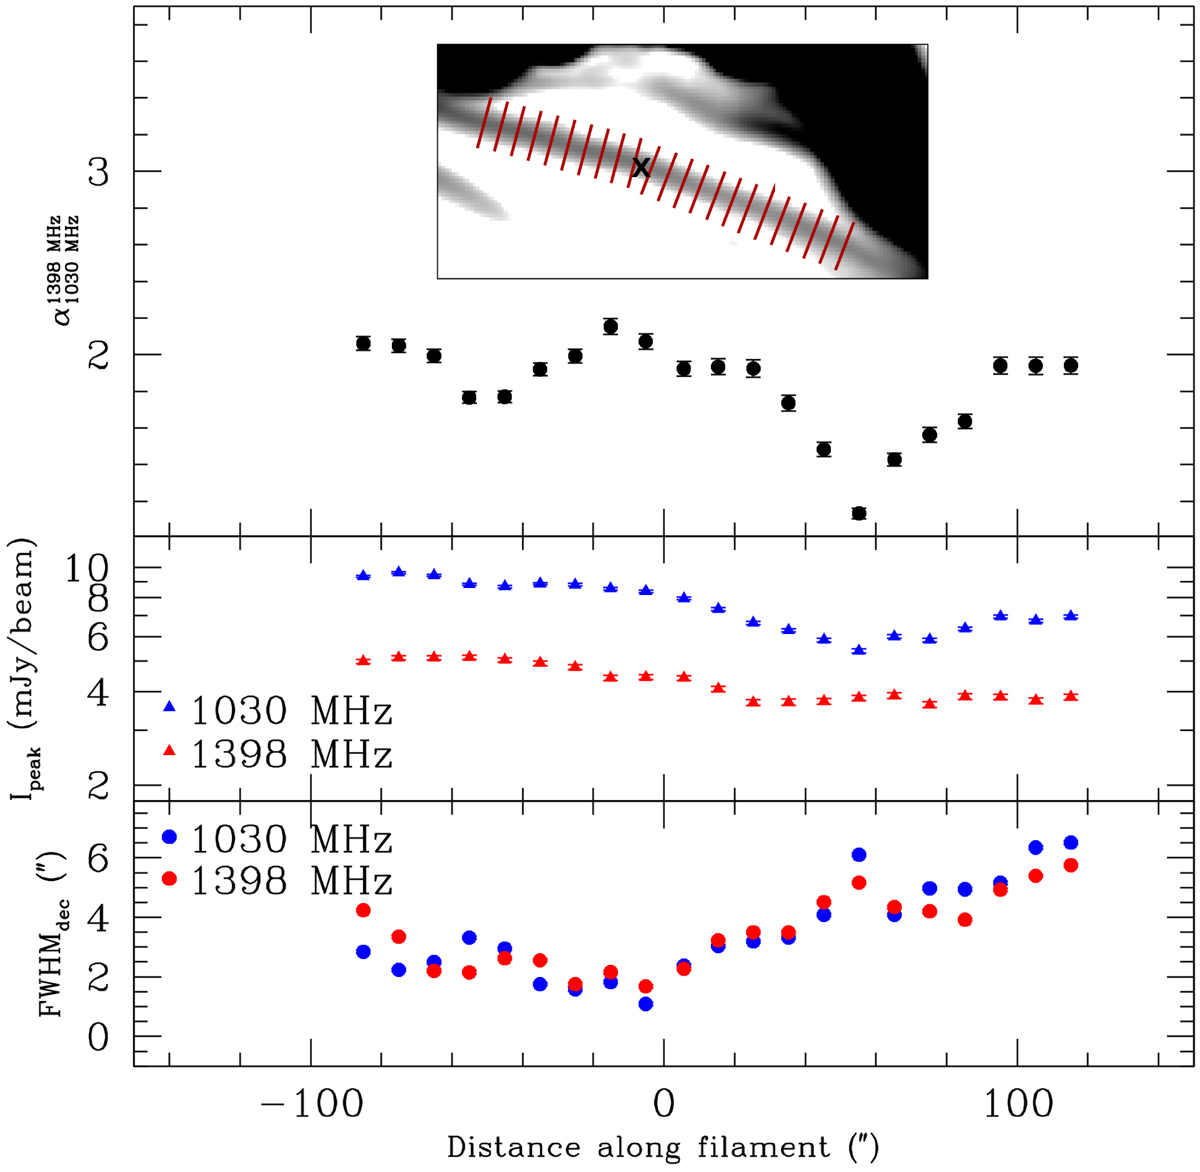
Fig. 4.

Top panel: spectral index profile between 1030 and 1398 MHz computed along the filament at the locations shown by the slices in the inset (see text for details). Middle panel: peak brightness at 1030 MHz (blue triangles) and at 1398 MHz (red triangles) along the filament at the location of the slices. Bottom panel: deconvolved FWHM at 1030 MHz (blue dots) and at 1398 MHz (red dots) along the filament at the location of the slices. The plotted error bars are comparable to the size of the dots.
Current usage metrics show cumulative count of Article Views (full-text article views including HTML views, PDF and ePub downloads, according to the available data) and Abstracts Views on Vision4Press platform.
Data correspond to usage on the plateform after 2015. The current usage metrics is available 48-96 hours after online publication and is updated daily on week days.
Initial download of the metrics may take a while.


