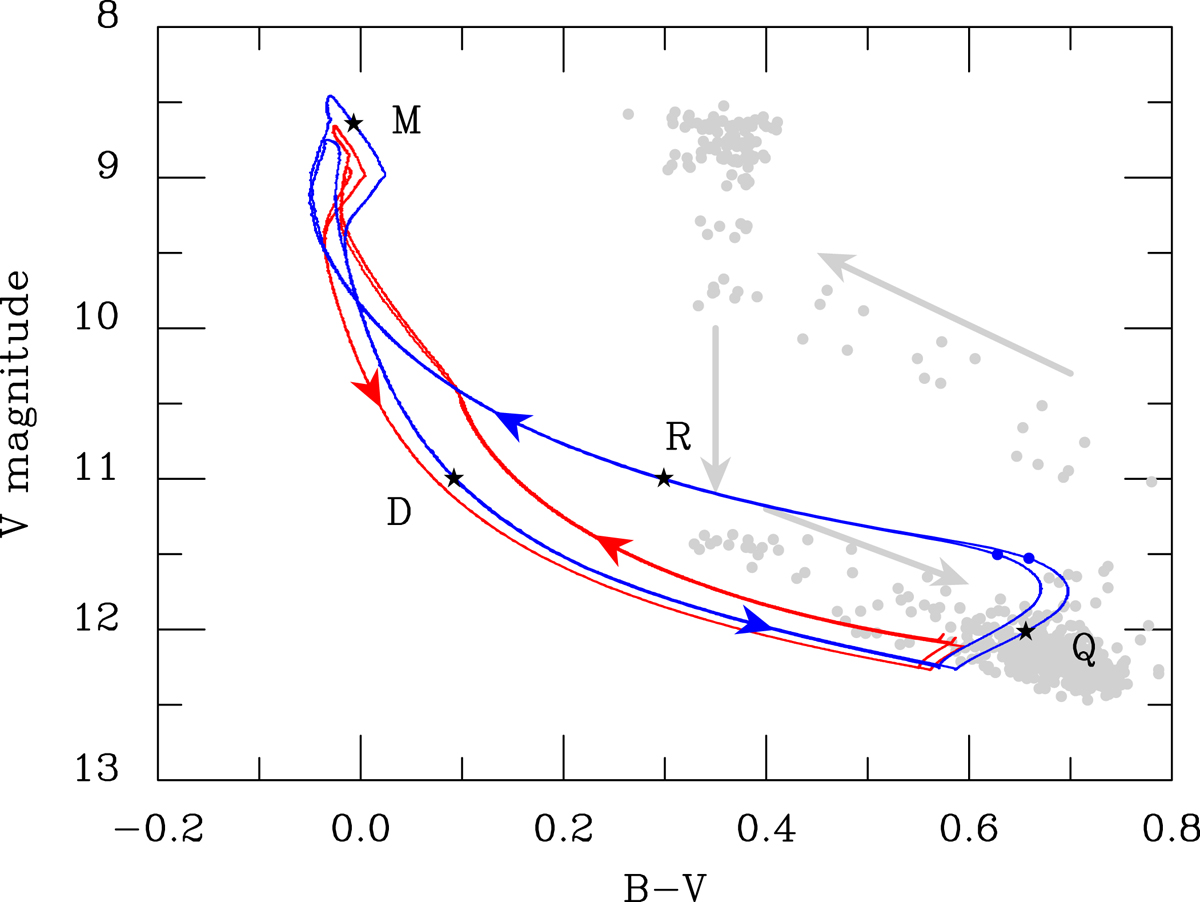
Fig. 6.

Colour variations predicted by the model for parameters corresponding to SS Cyg. Shown is the case where the inner disc is truncated (in blue), and when it extends down to the white dwarf surface (in red). For the sake of clarity, B − V has been increased by 0.02 mag in the truncated case, so that the blue and red curves do not superimpose during decay. The arrows indicate the direction of the time evolution. The dots at V ∼ 11.5 indicate the onset of the outburst in the truncated case. The differences between the short and long outbursts are visible, but small. The stars denote the positions at which spectra are shown in Fig. 7, and the grey dots are the observational data points.
Current usage metrics show cumulative count of Article Views (full-text article views including HTML views, PDF and ePub downloads, according to the available data) and Abstracts Views on Vision4Press platform.
Data correspond to usage on the plateform after 2015. The current usage metrics is available 48-96 hours after online publication and is updated daily on week days.
Initial download of the metrics may take a while.


