Open Access
Fig. 2.
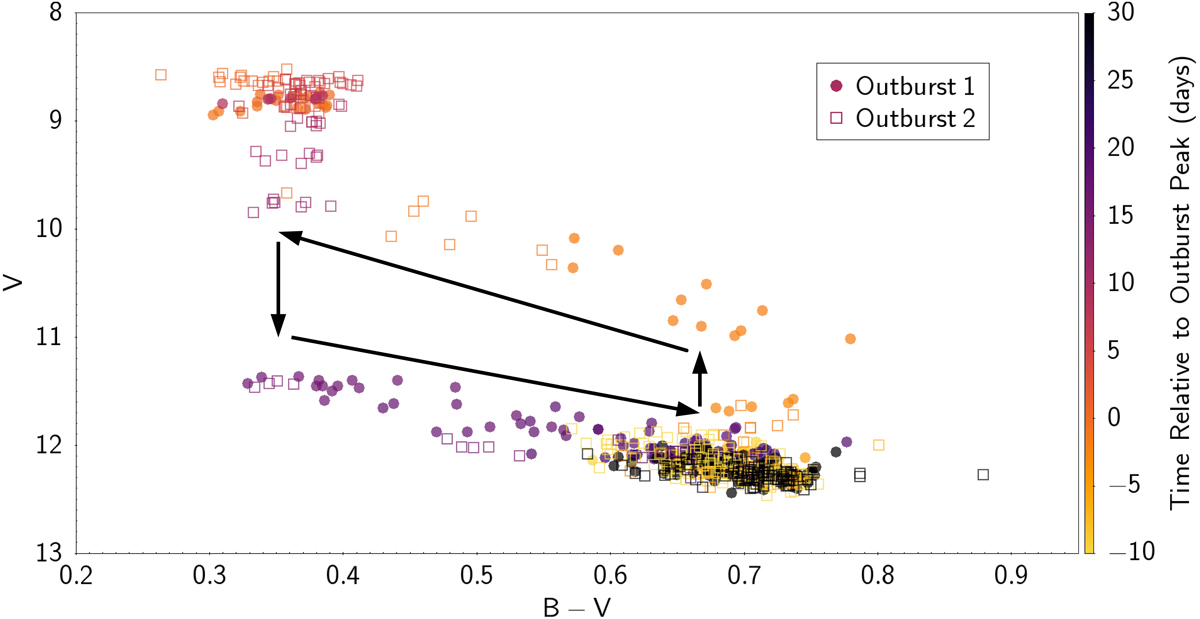
Colour variations across two outbursts of SS Cyg. The colour-coding is the same as in Fig. 1, and represents the time. The arrows show the direction of the time evolution in the diagram.
Current usage metrics show cumulative count of Article Views (full-text article views including HTML views, PDF and ePub downloads, according to the available data) and Abstracts Views on Vision4Press platform.
Data correspond to usage on the plateform after 2015. The current usage metrics is available 48-96 hours after online publication and is updated daily on week days.
Initial download of the metrics may take a while.