Fig. A.1.
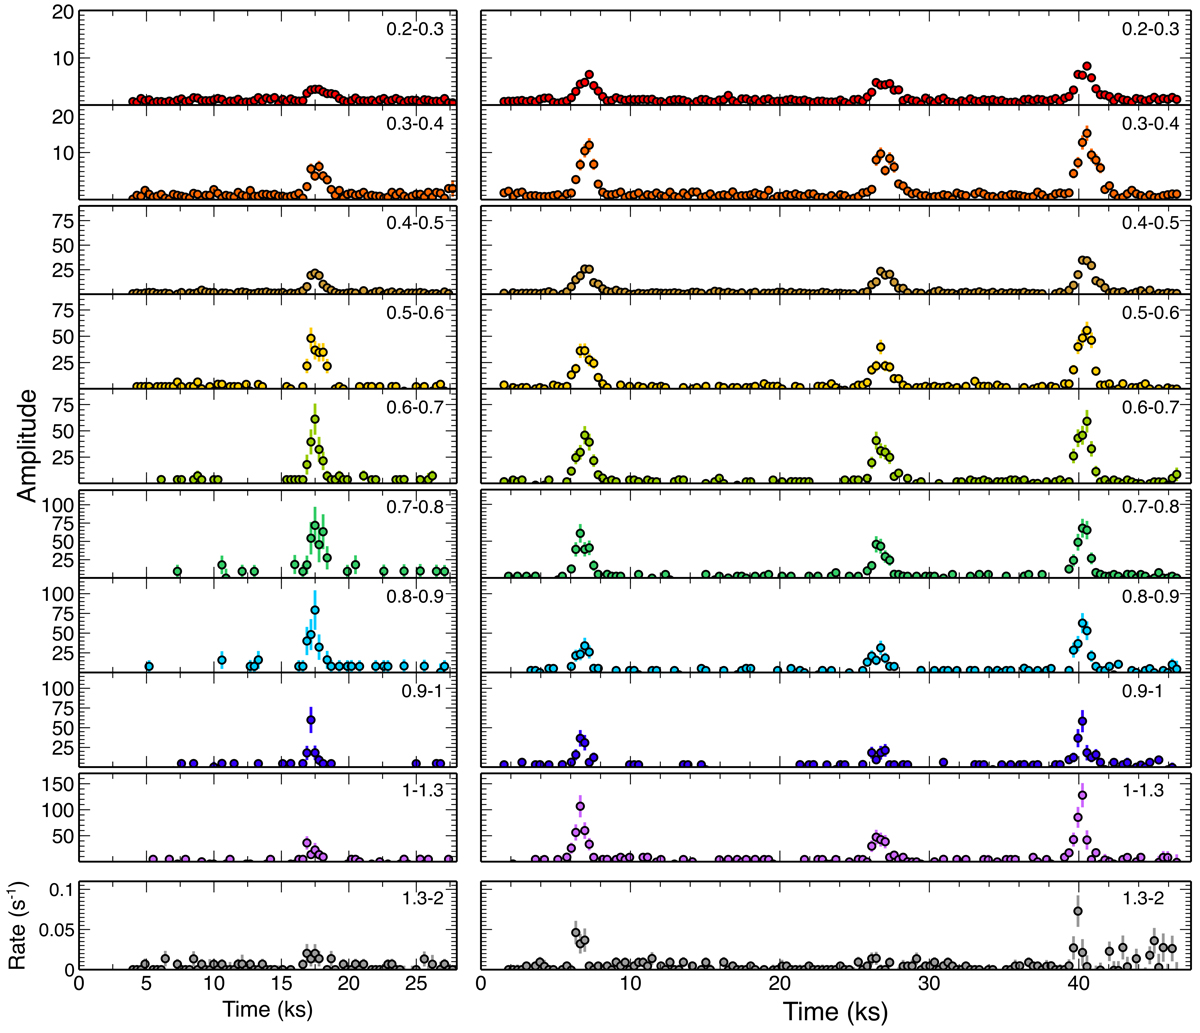
EPIC-pn light curves of RX J1301.9+2747 (December 2000 observation on the left, May 2019 observation on the right) binned to 300 s, corrected for the background and normalized to their quiescent count rate level, extracted in different energy bands labeled in units of keV in the top right corner of each panel. We note the different y-scales in different energy bands. In the bottom panels, we plot instead the light curve in the 1.3–2 keV band for the two epochs of observation.
Current usage metrics show cumulative count of Article Views (full-text article views including HTML views, PDF and ePub downloads, according to the available data) and Abstracts Views on Vision4Press platform.
Data correspond to usage on the plateform after 2015. The current usage metrics is available 48-96 hours after online publication and is updated daily on week days.
Initial download of the metrics may take a while.