Fig. 2.
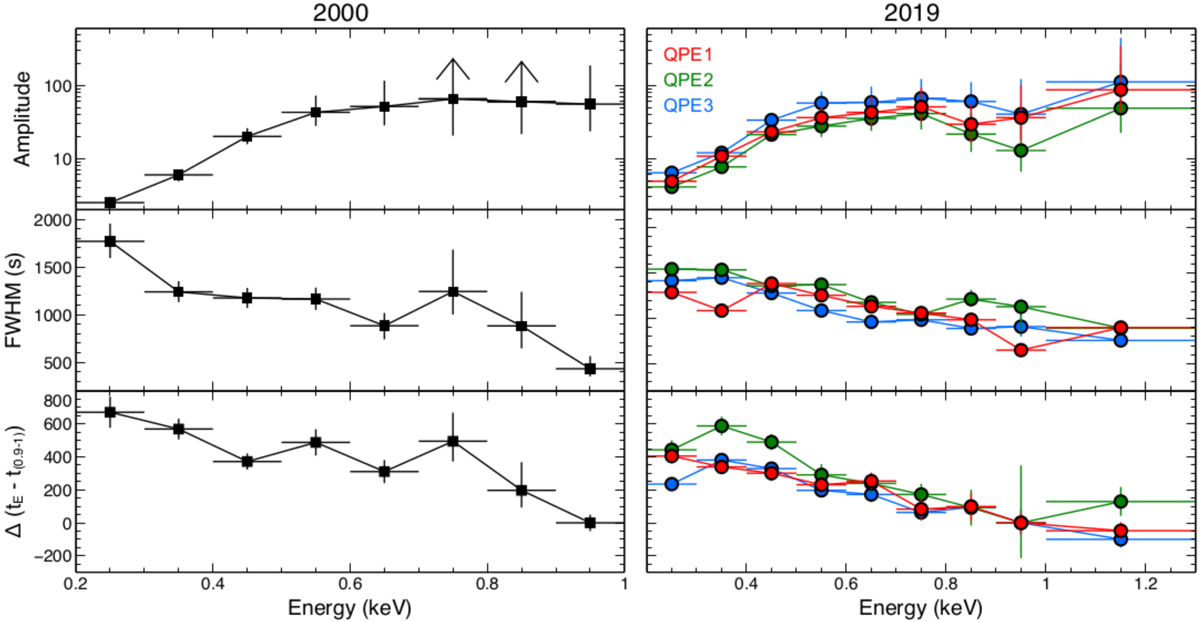
RX J1301.9+2747 QPE properties: amplitude (Gaussian intensity over quiescent count rate), duration (Gaussian FWHM), and peak time (Gaussian centroid) with respect to that measured in the 0.9 − 1 keV band. The 2000 QPE is plotted with black squares, the 2019 QPEs are plotted with circles (QPE1 in red, QPE2 in green, and QPE3 in blue).
Current usage metrics show cumulative count of Article Views (full-text article views including HTML views, PDF and ePub downloads, according to the available data) and Abstracts Views on Vision4Press platform.
Data correspond to usage on the plateform after 2015. The current usage metrics is available 48-96 hours after online publication and is updated daily on week days.
Initial download of the metrics may take a while.