Fig. 7.
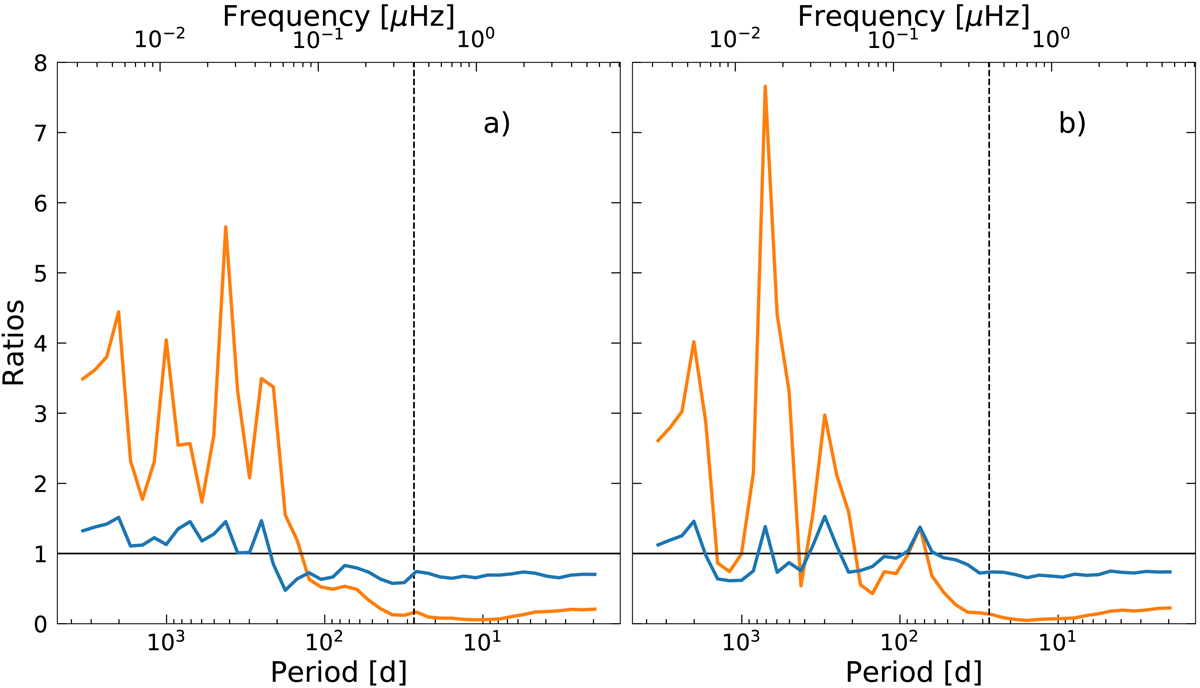
Ratios of the power spectra of solar brightness variations for Kepler as shown in Fig. 6. Blue lines represent the ratios of 57° to 90° and orange lines between 0° and 90°. Panel a: cycle 19 and panel b: cycle 22. The vertical dashed black line indicates the synodic solar rotation period at 27.3 days. The horizontal solid black line indicates a ratio of 1.
Current usage metrics show cumulative count of Article Views (full-text article views including HTML views, PDF and ePub downloads, according to the available data) and Abstracts Views on Vision4Press platform.
Data correspond to usage on the plateform after 2015. The current usage metrics is available 48-96 hours after online publication and is updated daily on week days.
Initial download of the metrics may take a while.