Fig. 5.
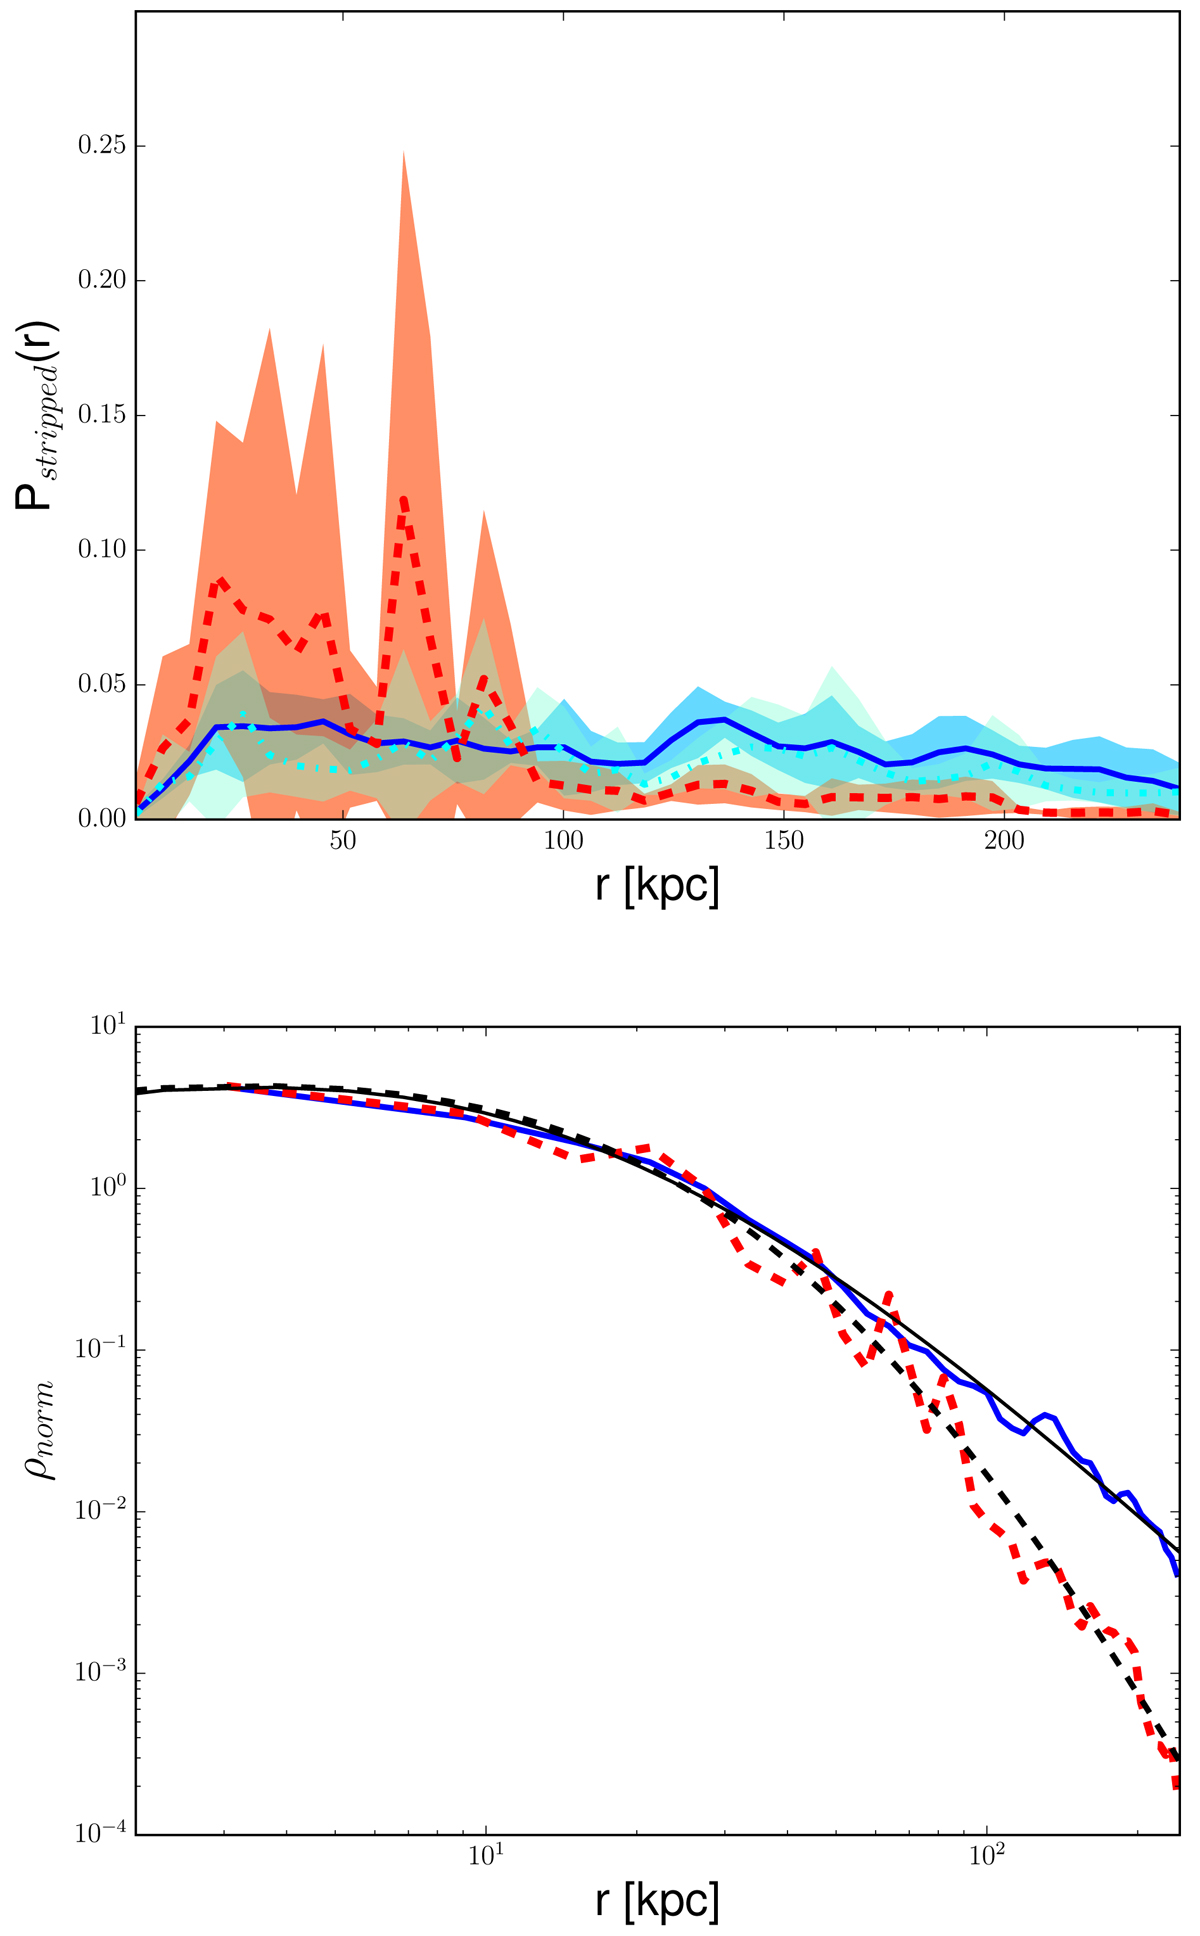
Top panel: radial profile of Pstripped for the stripped debris mass deposited at a given spherical shell, normalised to the total debris mass of stars and DM, respectively. Lines and colour-coding as in Fig. 4. Bottom panel: radial matter density profile of the debris in log-scale. Lines and colour-coding as in Fig. 4. The DM-only satellite data from MJ16 are not plotted here. The thick black and dashed black line are the best-fit profiles for the DM and stellar debris, respectively. All profiles are normalised to the corresponding density values at r ∼ 25 kpc.
Current usage metrics show cumulative count of Article Views (full-text article views including HTML views, PDF and ePub downloads, according to the available data) and Abstracts Views on Vision4Press platform.
Data correspond to usage on the plateform after 2015. The current usage metrics is available 48-96 hours after online publication and is updated daily on week days.
Initial download of the metrics may take a while.