Fig. 4.
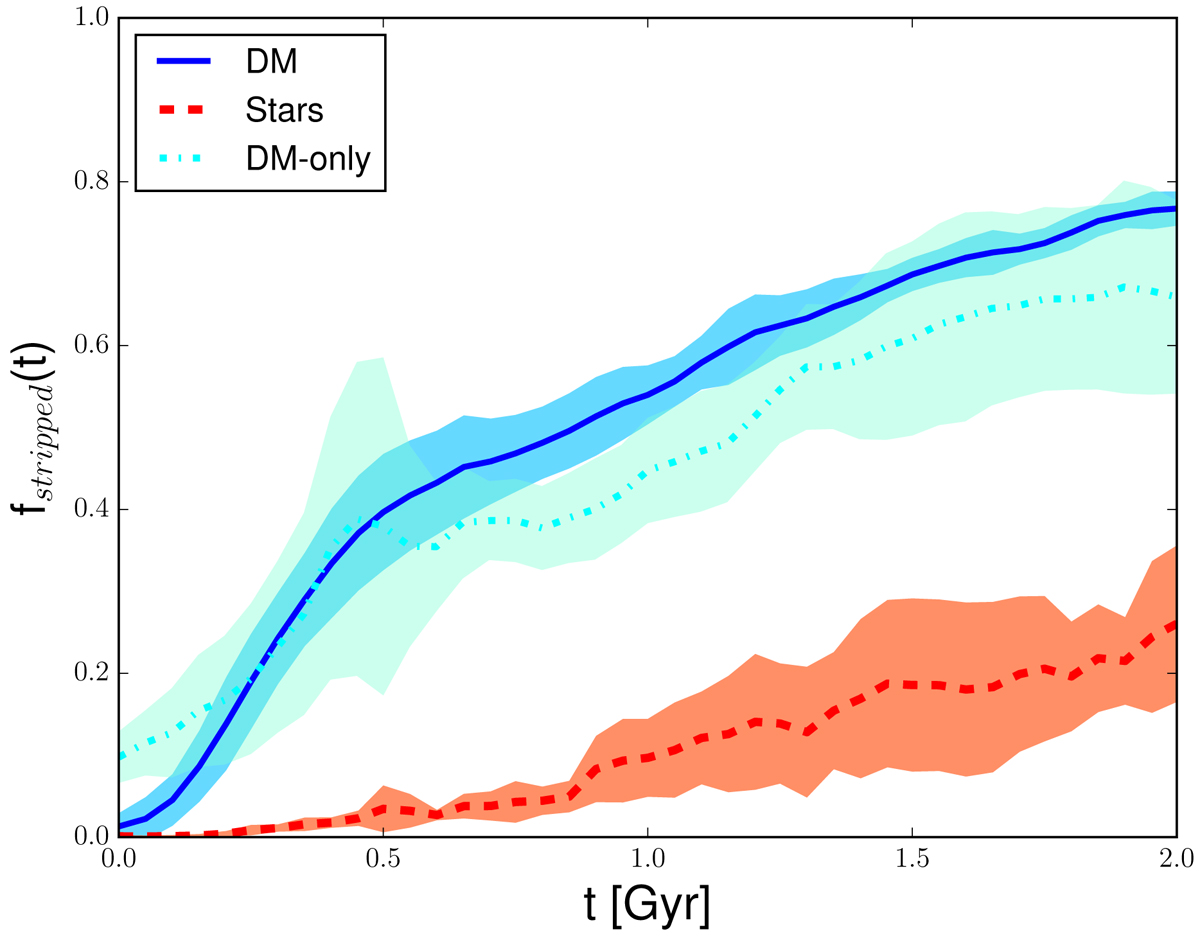
Fraction of the satellite matter stripped out of the tidal radii of all the satellites as a function of time. Colour-coding and lines: dashed red for stars, thick blue for DM, and dot-dashed cyan for DM-only satellites from the MJ16 simulations. For each colour, the lines are the average over the six simulations, and the shaded areas represent the rms scatter.
Current usage metrics show cumulative count of Article Views (full-text article views including HTML views, PDF and ePub downloads, according to the available data) and Abstracts Views on Vision4Press platform.
Data correspond to usage on the plateform after 2015. The current usage metrics is available 48-96 hours after online publication and is updated daily on week days.
Initial download of the metrics may take a while.