Fig. 2.
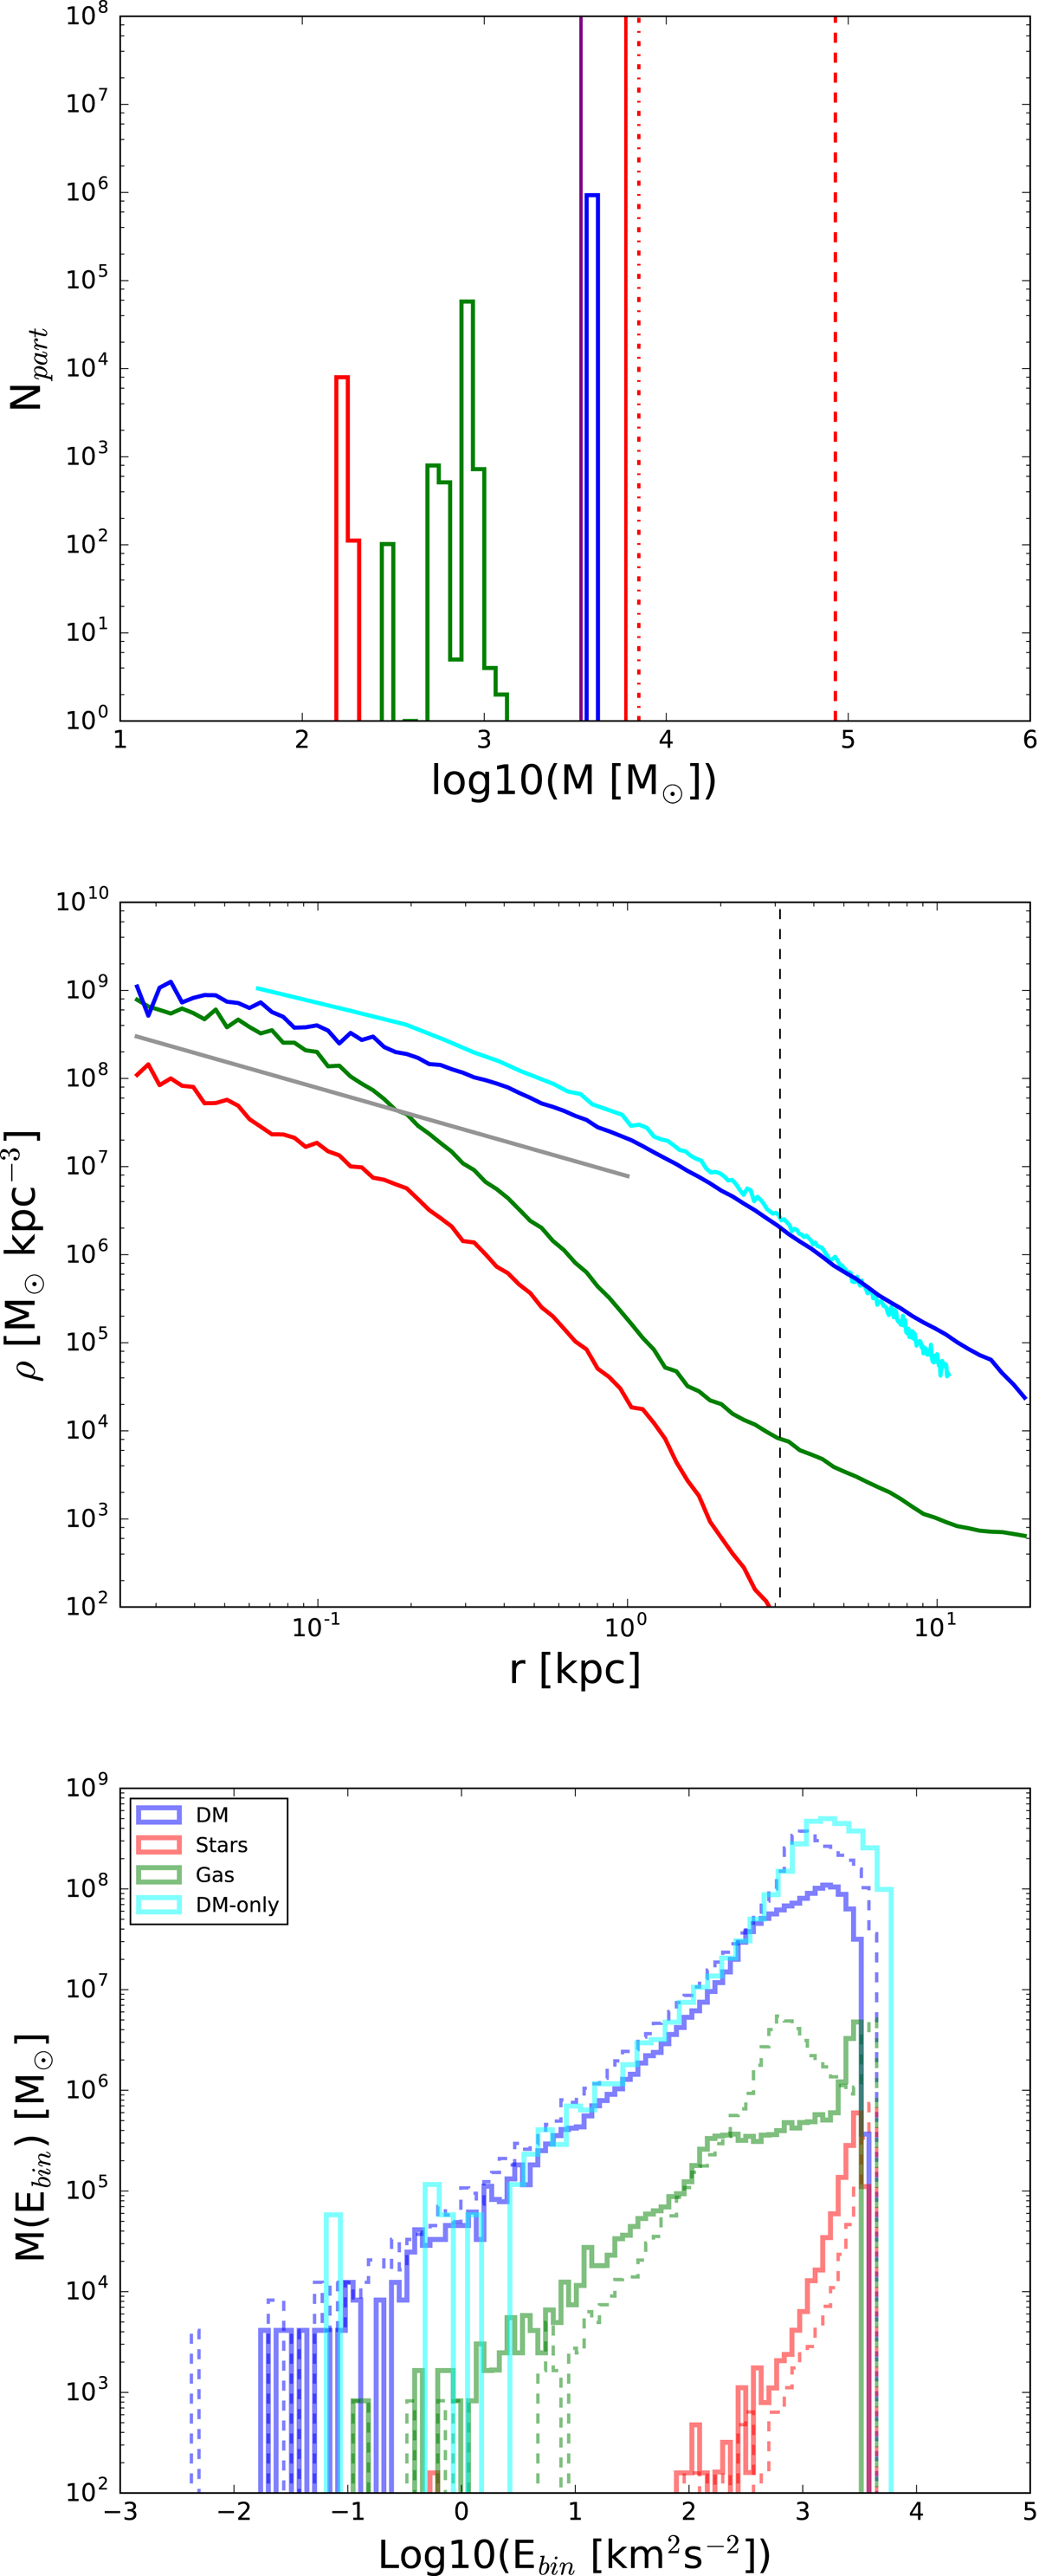
From top to bottom: particle mass distributions, radial density profiles, and specific energy distributions for the three components (stars, gas, and DM) of satellite 3. In all figures, red is for stars, green for gas, and blue for DM. Cyan is for one corresponding DM-only satellite from MJ16. Top panel: the additional vertical dashed red line is the stellar mass resolution for the TNG50 simulation, the red dot-dashed vertical line is for Latte, and the red thick line is for Eris. The purple thick line is for the disc resolution in the MW model of MJ16. Central panel: the density profiles are given as a function of the distance r from the density centre of the satellite. For comparison, the thick grey line represents an NFW inner profile (with radial dependence ∝r−1). The black dashed vertical line indicates the tidal radius position of satellite 3 after tidal radius rescaling from the corresponding DM-only satellite. Bottom panel: the dashed and thick histograms represent the specific energy distribution in terms of mass per energy bin for each component of satellite 3 before and after applying the tidal cut to the satellite, respectively. The cyan line shows the same for the DM-only satellite.
Current usage metrics show cumulative count of Article Views (full-text article views including HTML views, PDF and ePub downloads, according to the available data) and Abstracts Views on Vision4Press platform.
Data correspond to usage on the plateform after 2015. The current usage metrics is available 48-96 hours after online publication and is updated daily on week days.
Initial download of the metrics may take a while.