Fig. 1.
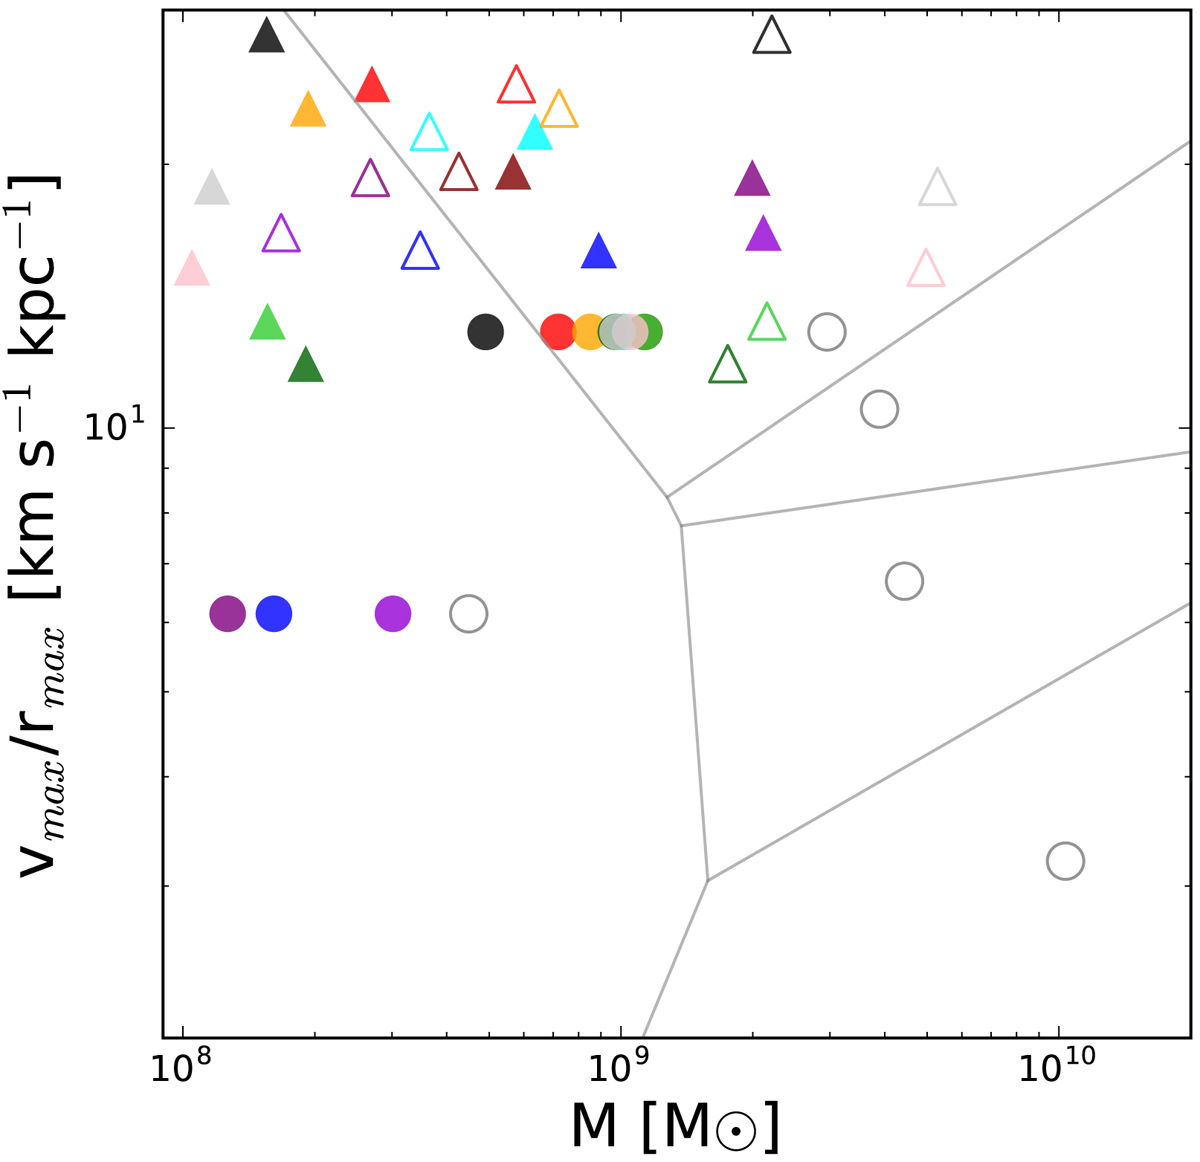
Distribution of the candidate best-matching dwarf galaxies in the log(M200)−log(vmax/rmax) plane. Empty grey circles represent all the five best-matching dwarf galaxies in the M17 sample, which are used for the six Aq simulations (see Table 2 for their properties). The tessellation with grey segments represents the division in regions where the satellite galaxies of MJ16 are closest to any of the five best-matching dwarf galaxies of M17. For the case of Aq-E2 the satellites of MJ16 are shown as empty triangles according to their M200 and vmax/rmax values. Filled triangles are the same satellites after tidal cutting, i.e. with their Mtid values. The filled circles show the corresponding M17 satellites after tidal cutting. The colours of the filled symbols represent the matched pairs. For Aq-E2 only sat1 and sat4 have triangles that fall in their regions.
Current usage metrics show cumulative count of Article Views (full-text article views including HTML views, PDF and ePub downloads, according to the available data) and Abstracts Views on Vision4Press platform.
Data correspond to usage on the plateform after 2015. The current usage metrics is available 48-96 hours after online publication and is updated daily on week days.
Initial download of the metrics may take a while.